指标特色 Indicator Features
MACD风云彩带指标是一个MACD特色指标,而MACD指标是一个用二条EMA均线(快线和慢线)之间的差距来跟踪和观察股价的变化趋势的技术分析指标。由于它能够比较真实可靠地反映股价的趋势和变化,人们把它称为指标之王和最为可靠的技术指标之一。
The MACD Fengyun Ribbon indicator is a MACD characteristic indicator, and the MACD indicator is a technical analysis indicator that uses the gap between two EMA moving averages (fast line and slow line) to track and observe the stock price trend. Because it can truly and reliably reflect the trend and changes of stock prices, people call it the king of indicators and one of the most reliable technical indicators.
指标说明 Indicator Description
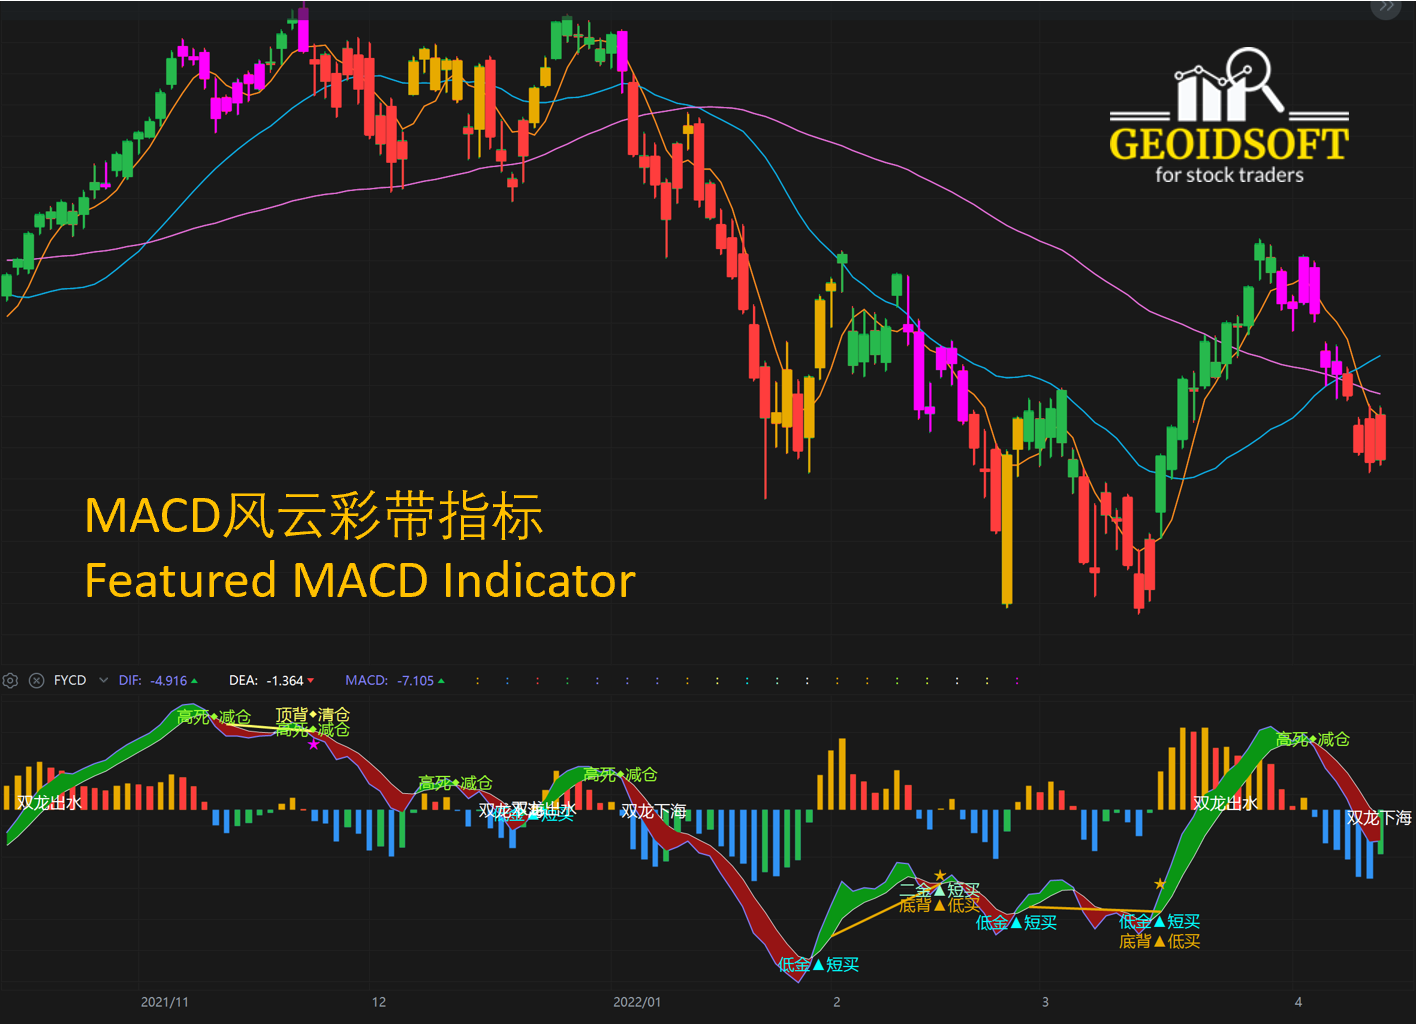
【MACD风云彩带指标】如上图副图所示,MACD风云彩带指标由通常的MACD快线和慢线构成的风云彩带和它们(快线和慢线)之间的差距所表示的彩色柱子构成的。为了区分这一指标所表示的各种关键信息点位,我们在风云彩带上作了标注,以便把握机会。标注的信息包括:
零轴之下:
低位死叉:低死▲清仓
低位金叉:低金▲短买
二次金叉:二金▲短买
底背离: 底背▲低买
双线上穿零轴:双龙出水
零轴之上:
高位金叉:高金◆加仓
高位死叉:高死◆减仓
二次死叉:二死◆减仓
顶背离: 顶背◆清仓
双线下穿零轴:双龙下海
【Featured MACD Indicator】As shown in the sub-picture above, the Featured MACD Indicator is composed of the usual MACD fast line and slow line in a Fengyun ribbon and the colored columns represented by the gap between them (fast line and slow line) . In order to distinguish the various key information points represented by this indicator, we have marked them on the wind and cloud ribbons so as to seize opportunities.
指标应用 Application
号称指标之王,MACD指标有着非常广泛应用。应用方法也多种多样。应用范例请观看我们的Youtube频道。Known as the king of indicators, the MACD indicator has a very wide range of applications. There are also various methods of application. For application examples, please watch our Youtube channel.
https://youtu.be/KJ3zVXJcn88
适用范围 Scope of Application
MACD风云彩带指标适合各种周期的盘面,从长期趋势的“年线”、“季线”和“月线”图,以及中期趋势的“周线”和“日线”图,甚至短期趋势的“小时”及“分钟”图,均可用它来观察股价的变化趋势。
The MACD wind and cloud ribbon indicator is suitable for various time cycles of the market, from the "annual line", "seasonal line" and "monthly line" charts of long-term trends, to the "weekly line" and "daily line" charts of medium-term trends, and even the short-term trend charts "hour" and "minute" charts, it can be used to observe the trend of stock price changes.

