指标特色 Indicator Features
六指金叉共振指标集合了各种专业分析师经常使用而且被广泛认可的六种指标。通常,依靠单一技术指标遇到错误信号的概率很高,单一技术指标提供的买卖信号也比较不可靠,因为影响价格波动的因素很多。 要提高操作的稳定性和准确性,就需要配合其他指标一起使用,才能捕捉到相对安全稳定的位置。
The six-indices golden cross resonance indicator is a collection of six indicators that are often used by various professional analysts and widely recognized. Usually, relying on a single technical indicator has a high probability of encountering wrong signals, and the buying and selling signals provided by a single technical indicator are also relatively unreliable, because there are many factors that affect price fluctuations. To improve the stability and accuracy of the operation, it needs to be used together with other indicators to capture a relatively safe and stable position.
为了解决各种指标的复杂分析,我们特地开发了这个六指金叉共振特色指标。基于各个技术指标的均值,如果目前的状态在均值之上,则表示该指标趋势向上,可视为一个启涨点。当多方指标均指向上涨时,说明市场处在一个共振向上的状态,投资相对安全。反之,当多种指标共振指向下跌时,投资的风险增大。
In order to solve the complex analysis of various indicators, we specially developed this six-indices golden cross resonance characteristic indicator. Based on the average value of each technical indicator, if the current state is above the average value, it means that the indicator is trending upward, which can be regarded as a starting point. When multiple indicators point to an upward trend, it means that the market is in a state of resonance and upward, and investment is relatively safe. Conversely, when multiple indicators resonate and point to a decline, the risk of investment increases.
指标原理 Indicator Principle
集合六种专业分析师经常使用而且被广泛认可的技术指标于一体,通过获取它们的共振信号帮助投资者快速掌握投资状态,有效避免走势馅阱。
It integrates six technical indicators that are frequently used by professional analysts and are widely recognized. By obtaining their resonance signals, it helps investors quickly grasp the investment status and effectively avoid trend traps.
集合的六种技术指标包括 The six technical indicators in the collection include:
- MACD指标 Moving Average Convergence/Divergence (MACD)
- KDJ指标 Stochastic Indicator
- RSI指标 Relative Strength Index Indicator
- LWR指标 Ultimate Oscillator Indicator
- BBI指标 Bull and Bear Index Indicator
- MFI指标 Money Flow Index Indicator
指标说明 Indicator Description
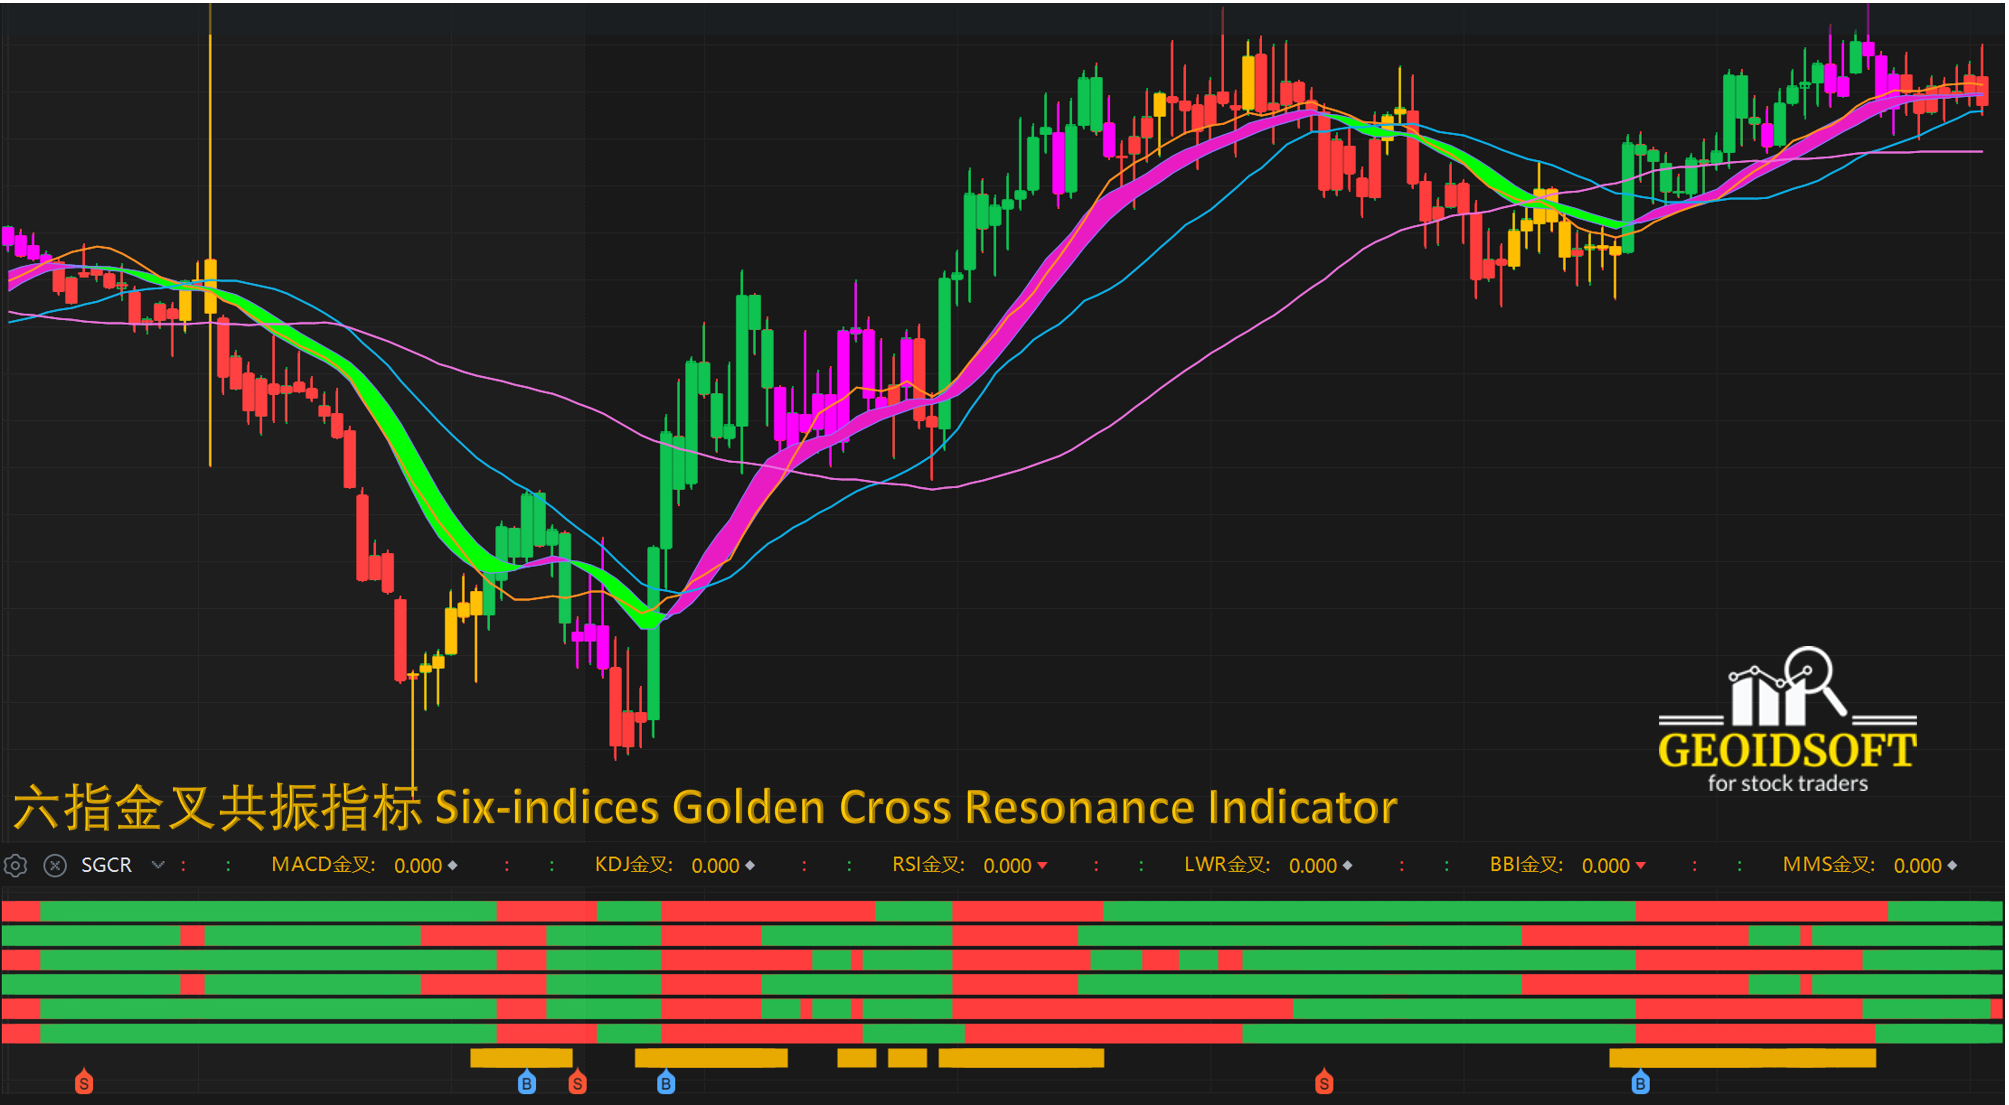
【六指金叉共振】如上图副图指标,每根红绿线,从上到下,分别代表MACD指标, KDJ指标, RSI指标, LWR指标, BBI指标和MFI指标。红色表示金叉后趋势向上,绿色表示死叉后趋势向下。底部的黄色线段表示全部六个指标达到共振趋势向上。
As shown in the sub-figure indicators above, each red and green line, from top to bottom, represents MACD indicator, KDJ indicator, RSI indicator, LWR indicator, BBI indicator and MMS indicator. Red indicates that the trend is upward after a golden cross, and green indicates that the trend is downward after a dead cross. The yellow line segment at the bottom indicates that all six indicators have reached a resonance trending up.
为了进一步增强六指金叉共振指标的特色功能,我们在共振信号的下方标注了根据彩色波段趋势确定的买卖信号点。如果趋势从跌转升并且六指标达到共振则确定为一个买点。如果趋势从升转跌并且六指标脱离共振则确定为一个卖点。
In order to further enhance the characteristic function of the six-indices golden cross resonance indicator, we have marked the buying and selling signal points below the resonance signal, which are determined according to the trend of the colored bands (see the main-chart). If the trend turns from down to up and the six indicators reach resonance, it is determined to be a buying point. If the trend turns from up to down and the six indicators are out of resonance, it is determined to be a selling point.
应用法则 Application Rules
根据六指金叉共振信号, 准确把握趋势走向, 有效避免走势馅阱。According to the six-indices golden cross resonance signal, accurately grasp the trend and effectively avoid the trend trap.
应用范例 Application Example
应用范例请观看我们的Youtube频道。For application examples, please watch our YouTube channel.
https://youtu.be/0BYGZGvbisY
适用范围 Scope of Application
六指金叉共振指标适合各种周期的盘面,从长期趋势的“年线”、“季线”和“月线”图,以及中期趋势的“周线”和“日线”图,甚至短期趋势的“小时”及“分钟”图,均可直观地观察当时的走势強弱。
The six-indices golden cross resonance indicator is suitable for various time cycles of the market, from the long-term trend "annual line", "seasonal line" and "monthly line" charts, as well as the medium-term trend "weekly line" and "daily line" charts, and even the "hour" and "minute" charts of the short-term trend can visually observe the strength of the trend at that time.
建议作为了解走势強弱变化的辅助指标, 结合其他指标进行综合分析观察,构建更有效的操盘系统, 帮助您进行操盘决策。
It is recommended to be used as an auxiliary indicator to understand the strength and weakness of the trend, combined with other indicators for comprehensive analysis and observation, to build a more effective trading system, and to help you make trading decisions.
注意事项 Precautions
指标的计算结果与一些预设的参数有关。可以根据自己习惯的操盘周期进行优化和调整, 以便达到最佳效果。
The calculation result of the indicator is related to some preset parameters. It can be optimized and adjusted according to the trading cycle you are used to in order to achieve the best results.
另外,由于交易数据的完整性问题,部分指数图表和部分股票/商品可能不适用于该指标,请注意!
In addition, due to the completeness issue of transaction data, some index charts and some stocks/commodities may not be applicable to this indicator, please pay attention!

