指标特色 Indicator Features
牛股启动指标是一个简单直观实用的选股买入指标。它的计算公式好像来自一位炒股老手的经验总结。
The The bull stock start indicator is a simple, intuitive and practical stock selection and buying indicator. Its calculation formula seems to come from the experience summary of a veteran stock trader.
指标说明 Indicator Description
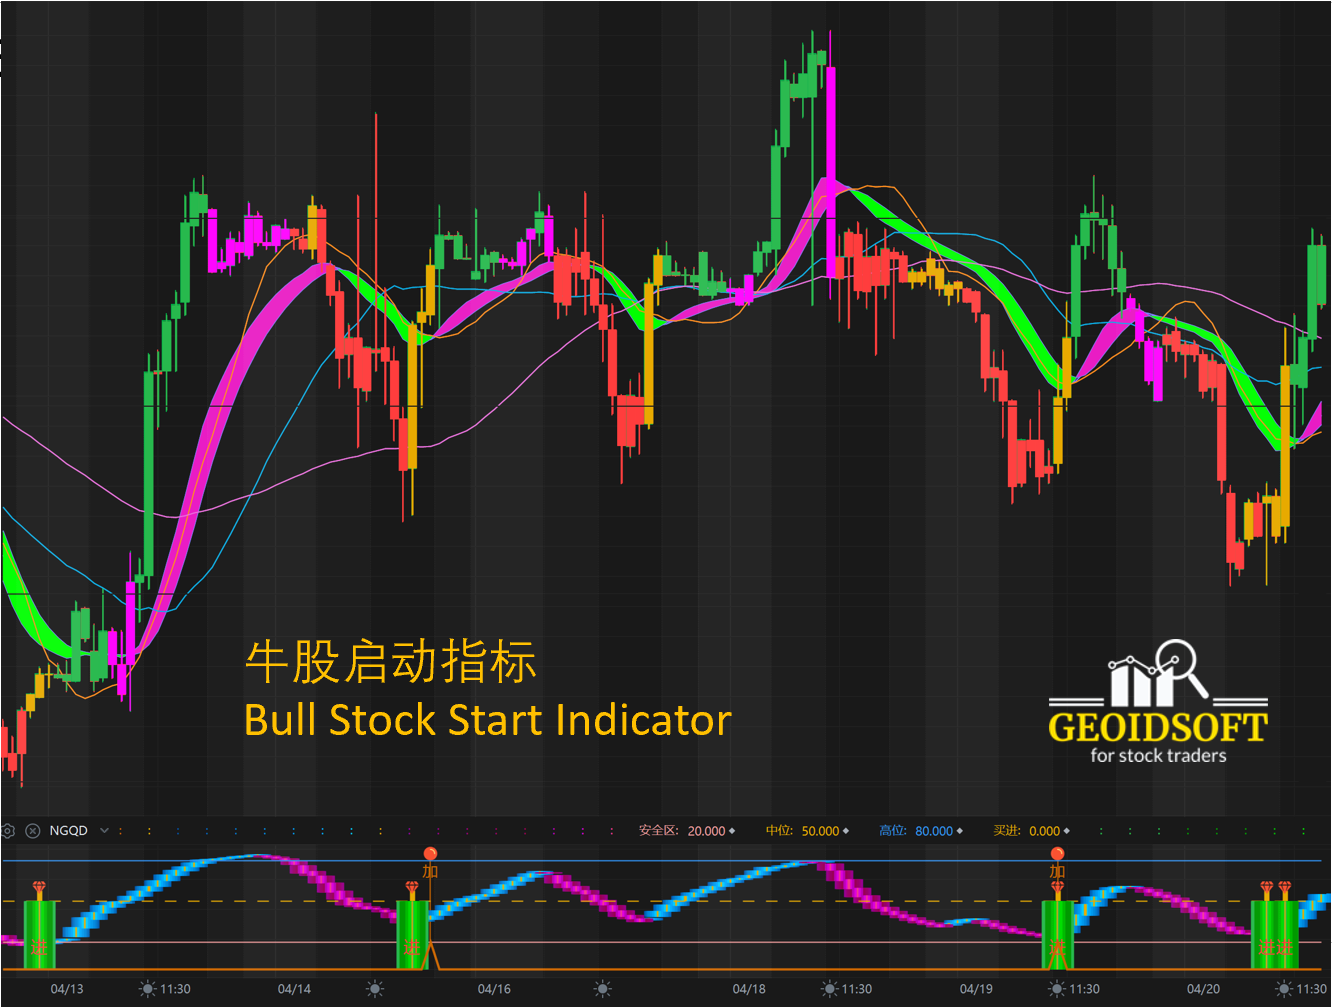
【牛股启动指标】如上图副图指标,牛股启动指标主要由一条反映牛熊趋势的柱线(青色表示上涨,紫色表示下跌)和加注的买入信号(绿色宽柱表示买进,小圆球吊线表示加仓)组成。
【Bull Stock Start Indicator】The bull stock start indicator is mainly composed of a column line reflecting the bull-bear trend (cyan indicates rising, purple indicates falling) and buy signals (a green wide column indicates buying, and a small ball hanging line indicates increasing positions).
指标应用 Application
牛股启动指标使用非常简单,选择一个股票后,调用这一指标,首先查验过去的历史数据看那一个时间周期比较适合,然后就按确定的时间周期进行交易。通常,日K线图一般都是可以的。
The bull stock start indicator is very simple to use. After selecting a stock, call this indicator, first check the past historical data to see which time period is more suitable, and then trade according to the determined time period. Usually, daily K-line charts are generally acceptable.
应用范例请观看我们的Youtube频道。For application examples, please watch our Youtube channel.
https://youtu.be/9LfQtOv6WAo
建议作为一个选股指标,证实目前您对某一股票走势的判断,同时结合其他指标进行综合分析观察,帮助您进行操盘决策。
It is recommended to be used as a stock selection indicator to confirm your current judgment on the trend of a certain stock, and to conduct comprehensive analysis and observation in combination with other indicators to help you make trading decisions.
适用范围 Scope of Application
牛股启动指标从计算原理上适合各种周期的盘面,从长期趋势的“年线”、“季线”和“月线”图,以及中期趋势的“周线”和“日线”图,甚至短期趋势的“小时”及“分钟”图。实际应用时,一般采用日K线图做中长线投资比较准确。
The bull stock start indicator is suitable for various cycles of the market in terms of calculation principles, from the "annual line", "seasonal line" and "monthly line" charts of long-term trends, and the "weekly line" and "daily line" charts of medium-term trends, Even "hourly" and "minute" charts of short-term trends. In practical applications, it is generally more accurate to use the daily K-line chart.

