指标特色 Indicator Features
海底捞月特色指标是一个简单直观实用的选股买入指标。它是一个展示主力吸筹并将产生趋势反转过程的指标,它的特色是帮助您了解主力吸筹,精准抄底!
Haidilaoyue characteristic indicator is a simple, intuitive and practical stock selection and buying indicator. It is an indicator that shows the main force's accumulation of funds and will produce a trend reversal process. Its feature is to help you understand the main force's accumulation of funds and accurately buy at the bottom!
指标说明 Indicator Description
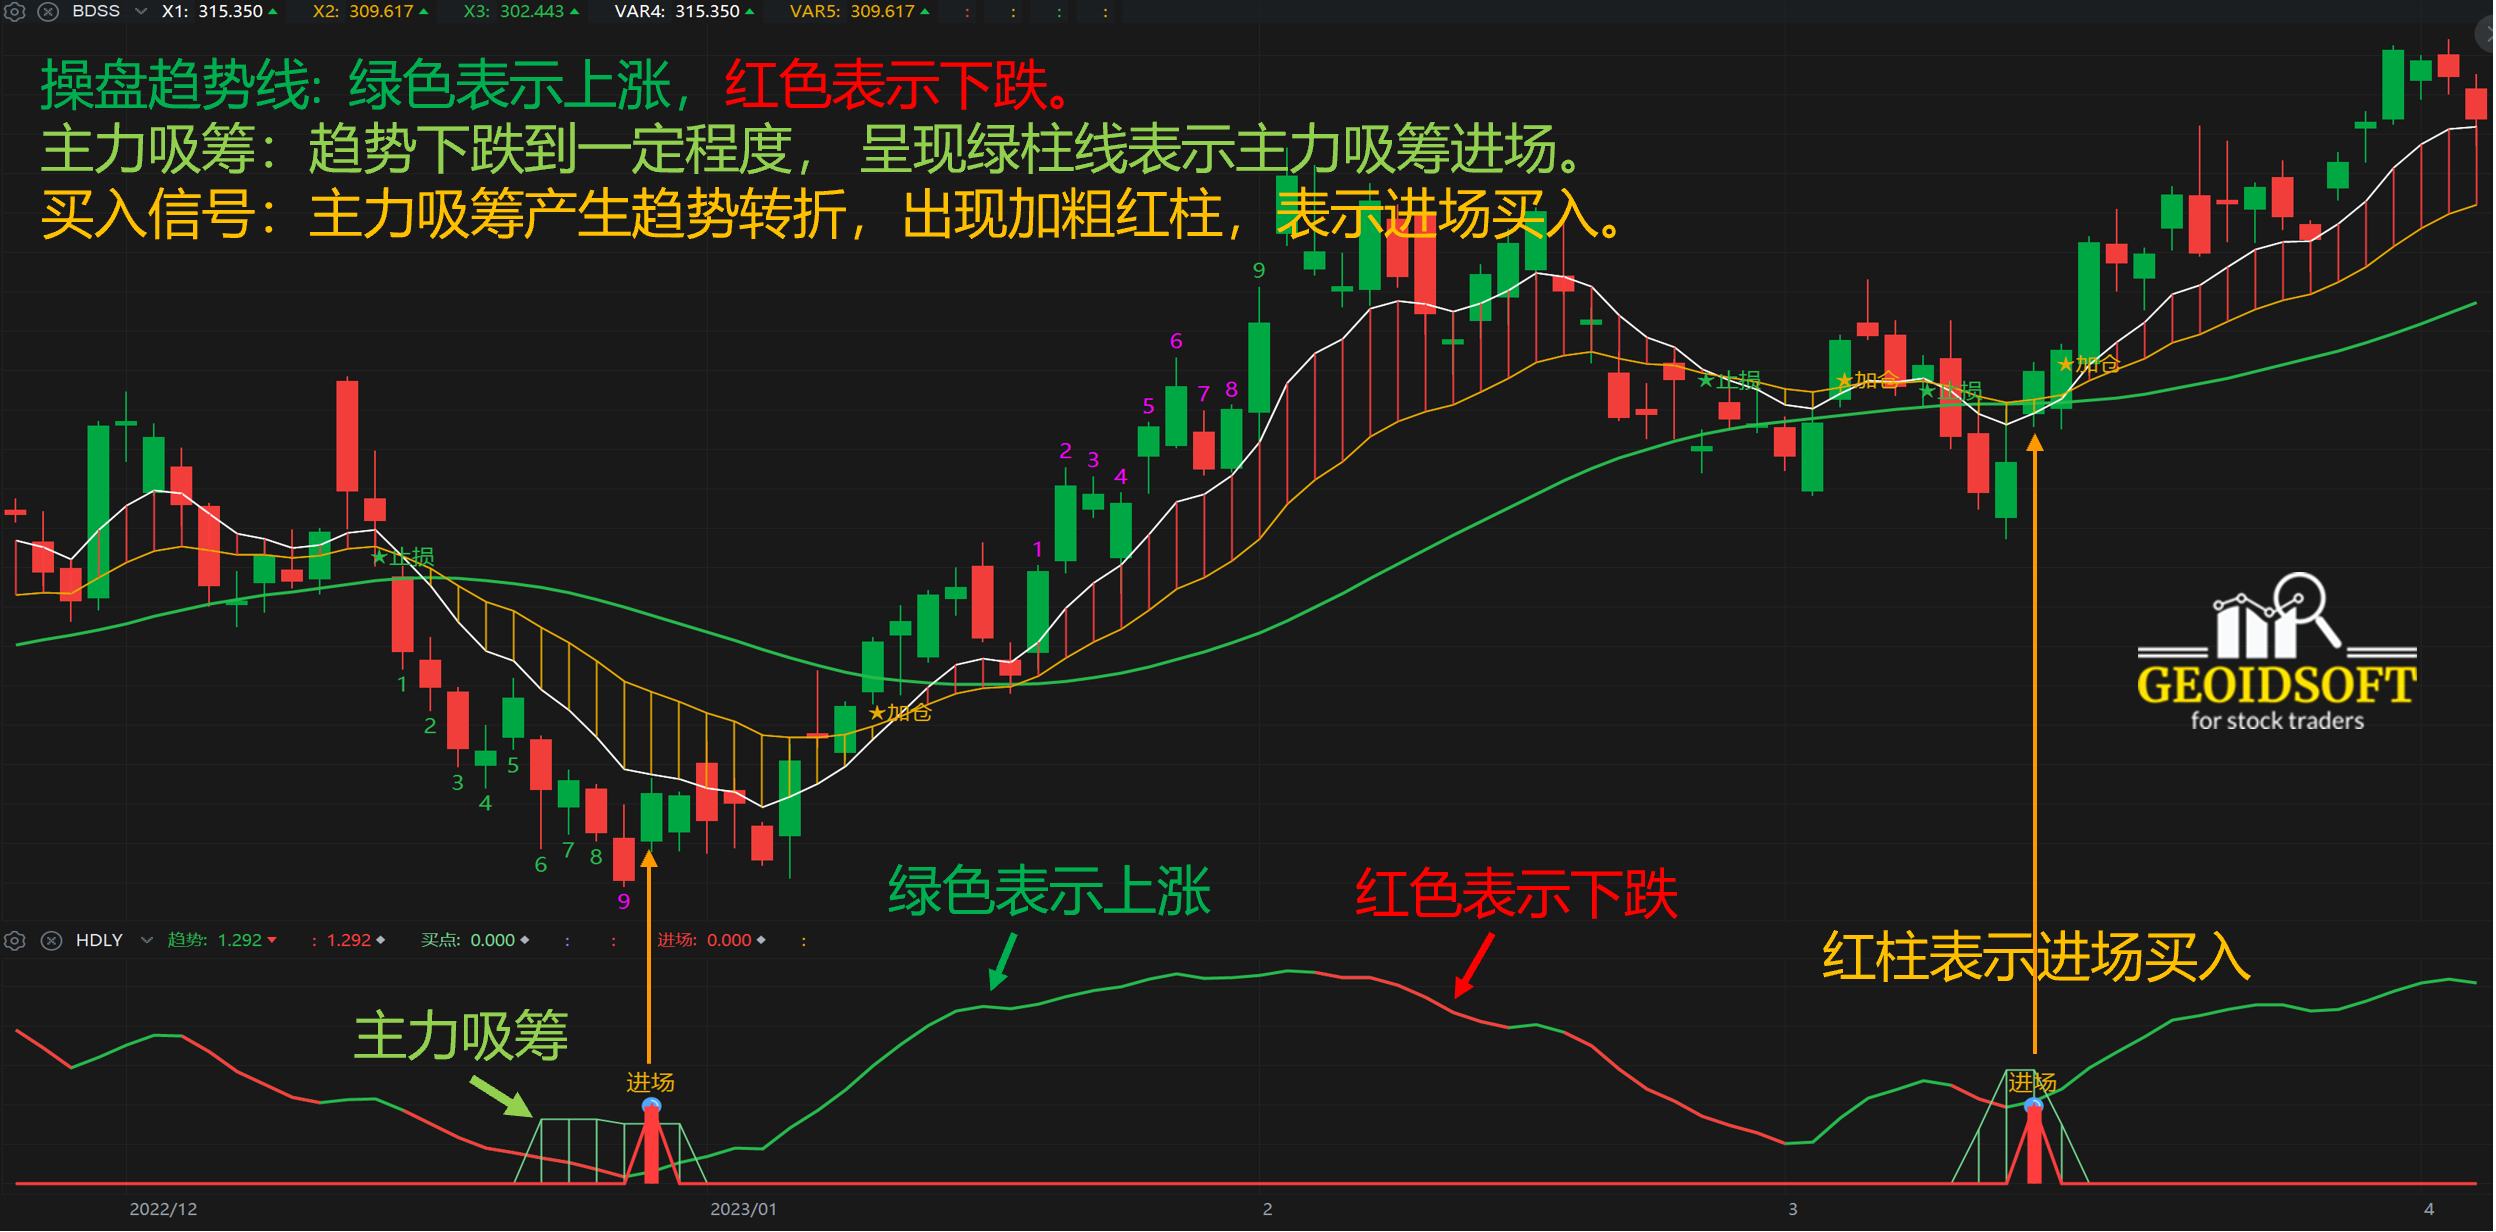
【海底捞月指标】如上图副图指标,海底捞月指标主要由以下三部分组成:
- 操盘趋势线: 绿色表示上涨,红色表示下跌。
- 主力吸筹:趋势下跌到一定程度, 呈现绿柱线表示主力吸筹进场。
- 买入信号:主力吸筹产生趋势转折,出现加粗红柱,表示进场买入。
【Haidilaoyue Indicator】As shown in the sub-chart indicator above, the Haidilaoyue indicator is mainly composed of the following three parts:
- Trading trend line: green indicates an increase, red indicates a decrease.
- Main force accumulation: When the trend falls to a certain extent, a green column line appears, indicating that the main force is entering the market to buy shares.
- Buy signal: The main force's accumulation of funds produces a trend reversal, and a bold red column appears, indicating an entry to buy.
指标应用 Application
海底捞月指标使用非常简单,选择一个股票后,调用这一指标,首先查验过去的历史数据看那一个时间周期比较适合,然后就按确定的时间周期进行交易。通常,日K线图一般都是可以的。
The Haidilaoyue indicator is very simple to use. After selecting a stock, call this indicator, first check the past historical data to see which time period is more suitable, and then trade according to the determined time period. Usually, daily K-line charts are generally acceptable.
应用范例请观看我们的Youtube频道。For application examples, please watch our Youtube channel.
https://youtu.be/azbT5CIxuek
建议作为一个选股指标,证实目前您对某一股票走势的判断,同时结合其他指标进行综合分析观察,帮助您进行操盘决策。
It is recommended to be used as a stock selection indicator to confirm your current judgment on the trend of a certain stock, and to conduct comprehensive analysis and observation in combination with other indicators to help you make trading decisions.
适用范围 Scope of Application
海底捞月指标从计算原理上适合各种周期的盘面,从长期趋势的“年线”、“季线”和“月线”图,以及中期趋势的“周线”和“日线”图,甚至短期趋势的“小时”及“分钟”图。实际应用时,一般采用日K线图做中长线投资比较准确。
The Haidilaoyue indicator is suitable for various cycles of the market in terms of calculation principles, from the "annual line", "seasonal line" and "monthly line" charts of long-term trends, and the "weekly line" and "daily line" charts of medium-term trends, Even "hourly" and "minute" charts of short-term trends. In practical applications, it is generally more accurate to use the daily K-line chart.

