指标特色 Indicator Features
黄金顶底操盘指标是一个通过寻找股价的底部黄金坑和顶部天花板来构建的一个特色指标。它的特色是帮助您买在黄金坑,卖在天花板!!
The gold top and bottom trading indicator is a special indicator constructed by finding the bottom golden pit and the top ceiling of the stock price. Its feature is to help you buy at the golden pit and sell at the ceiling!!
指标说明 Indicator Description
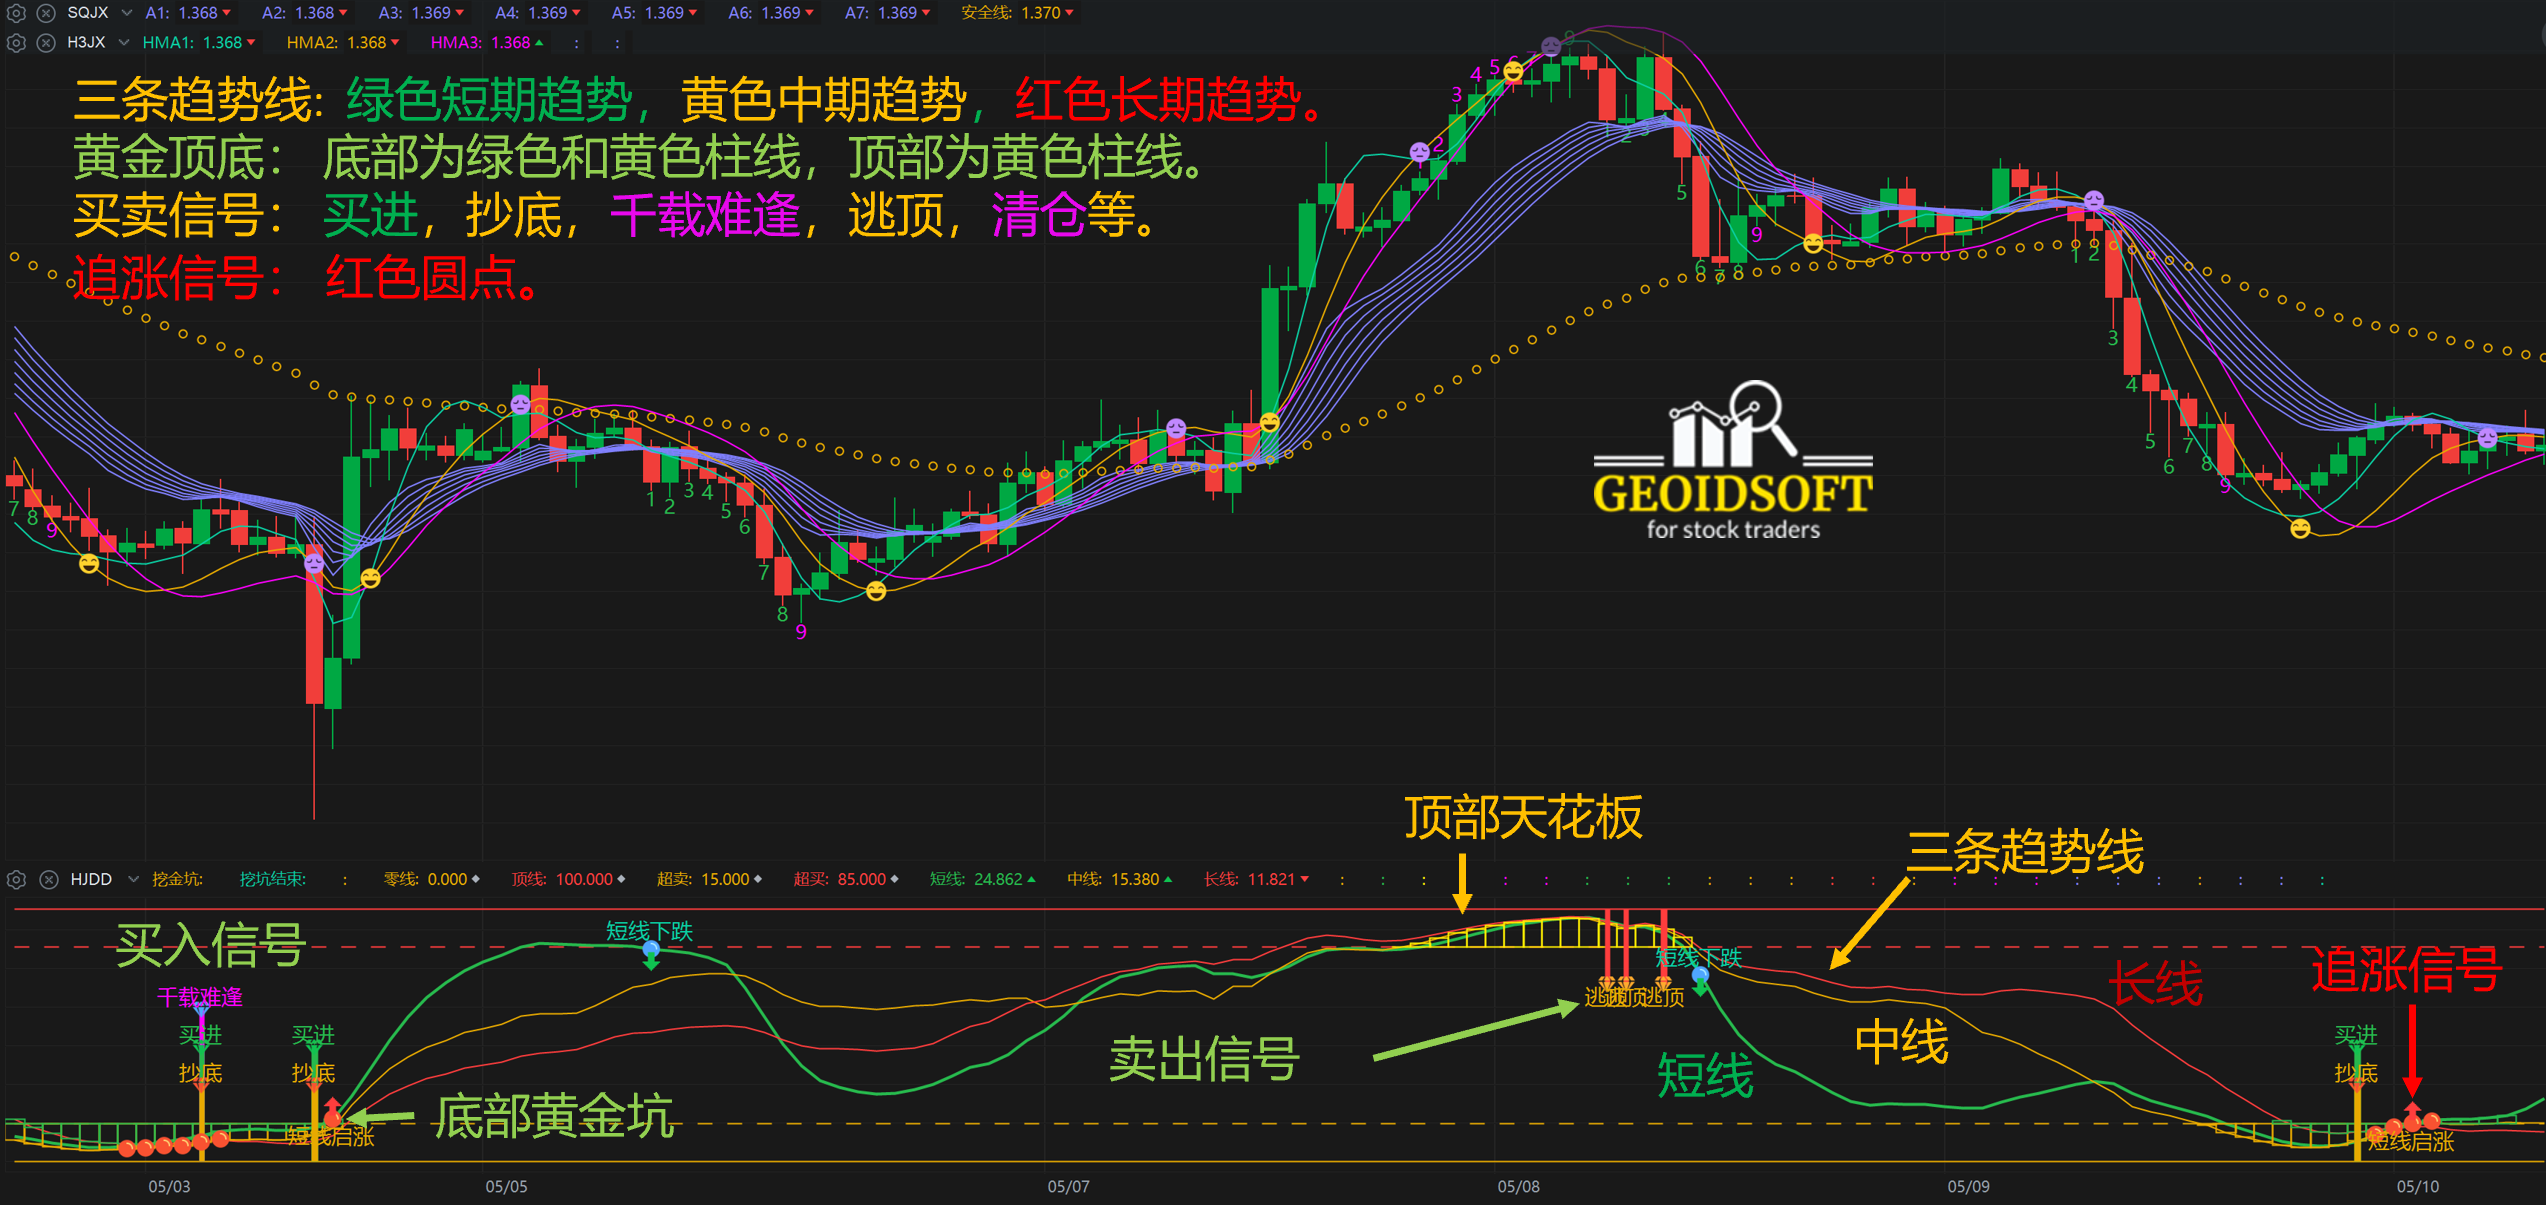
【黄金顶底操盘指标】如上图副图指标,黄金顶底操盘指标主要由以下部分组成:
- 三条趋势线: 绿色短期趋势,黄色中期趋势,红色长期趋势。
- 黄金顶底: 底部为绿色和黄色柱线,顶部为黄色柱线。
- 买卖信号: 买进,抄底,千载难逢,逃顶,清仓等。
- 追涨信号: 红色圆点。
【Gold top and bottom trading indicator 】As shown in the sub-chart indicator above, the gold top and bottom trading indicator is mainly composed of the following parts:
- Three trend lines: green short-term trend, yellow medium-term trend, red long-term trend.
- Golden top and bottom: the bottom is green and yellow bars, the top is yellow bars.
- Buy and sell signals: buy, bottom pick, golden pit, escape the top, clear positions, etc.
- Continuous buy signal: red dot.
指标应用 Application
黄金顶底操盘指标使用非常简单,选择一个股票后,调用这一指标,首先查验过去的历史数据看那一个时间周期比较适合,然后就按确定的时间周期进行交易。通常,日K线图一般都是可以的。
The gold top and bottom trading indicator is very simple to use. After selecting a stock, call this indicator, first check the past historical data to see which time period is more suitable, and then trade according to the determined time period. Usually, daily K-line charts are generally acceptable.
应用范例请观看我们的Youtube频道。For application examples, please watch our Youtube channel.
https://youtu.be/ZW3F-Lg9_Fo
建议作为一个选股指标,证实目前您对某一股票走势的判断,同时结合其他指标进行综合分析观察,帮助您进行操盘决策。
It is recommended to be used as a stock selection indicator to confirm your current judgment on the trend of a certain stock, and to conduct comprehensive analysis and observation in combination with other indicators to help you make trading decisions.
适用范围 Scope of Application
黄金顶底操盘指标从计算原理上适合各种周期的盘面,从长期趋势的“年线”、“季线”和“月线”图,以及中期趋势的“周线”和“日线”图,甚至短期趋势的“小时”及“分钟”图。实际应用时,一般采用日K线图做中长线投资比较准确。
The gold top and bottom trading indicator is suitable for various cycles of the market in terms of calculation principles, from the "annual line", "seasonal line" and "monthly line" charts of long-term trends, and the "weekly line" and "daily line" charts of medium-term trends, Even "hourly" and "minute" charts of short-term trends. In practical applications, it is generally more accurate to use the daily K-line chart.
注意事项 Precautions
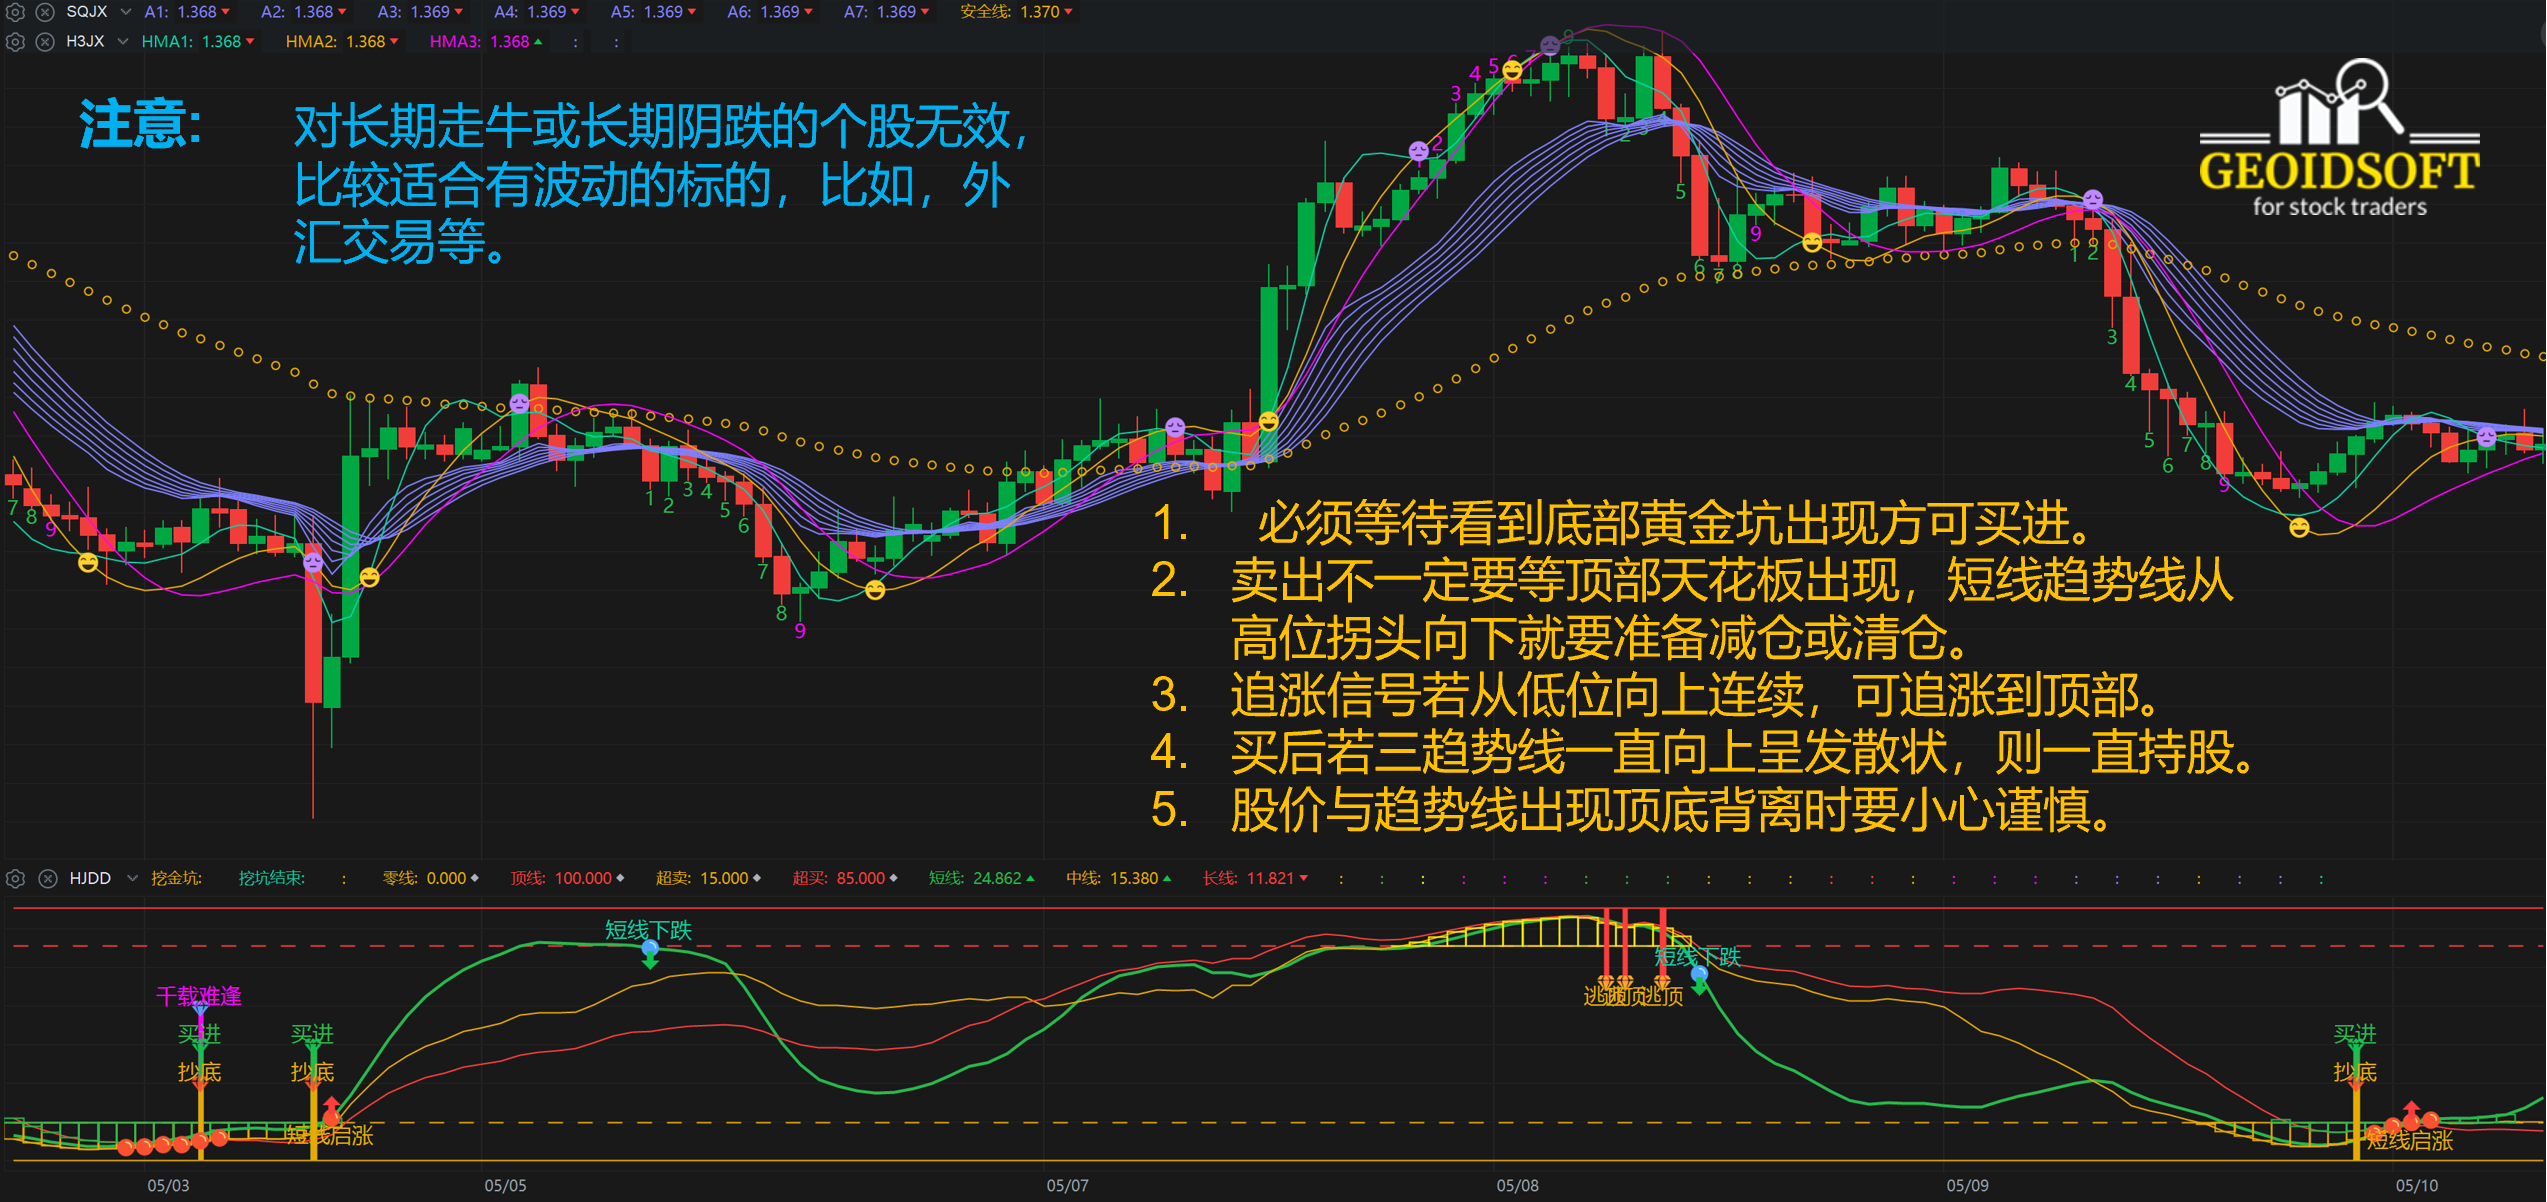
这一指标对有波动特性的股票比较有效,对于长期上涨或者下跌的股票效果不好。指标的计算结果与预设的参数有关。可以根据不同的股票波动特性进行优化和调整, 以便达到最佳效果。
This indicator is more effective for stocks with volatile characteristics, but not so effective for stocks that rise or fall over a long period of time. The calculation result of the indicator is related to the preset parameters. It can be optimized and adjusted according to different stock volatility characteristics in order to achieve the best effect.

