指标原理与特色 Indicator principles and characteristics
趋向运动指标,英文叫“Directional Movement Index",简称DMI指标。它是通过分析股票价格在涨跌过程中买卖双方力量均衡点的变化情况,即多空双方的力量的变化受价格波动的影响而发生由均衡到失衡的循环过程,从而提供趋势判断依据的一种技术指标。
DMI指标的基本原理是在于寻找股票价格涨跌过程中,股价藉以创新高价或新低价的功能,研判多空力量,进而寻求买卖双方的均衡点及股价在双方互动下波动的循环过程。在大多数指标中,绝大部分都是以每一日的收盘价的走势及涨跌幅的累计数来计算出不同的分析数据,其不足之处在于忽略了每一日的高低之间的波动幅度。比如某个股票的两日收盘价可能是一样的,但其中一天上下波动的幅度不大,而另一天股价的震幅却在10%以上,那么这两日的行情走势的分析意义决然不同,这点在其他大多数指标中很难表现出来。而DMI指标则是把每日的高低波动的幅度因素计算在内,从而更加准确的反应行情的走势及更好的预测行情未来的发展变化。
指标特色: 能准确的反应行情的走势及更好的预测行情未来的发展变化,适用于短中长各种时间周期,特别是具有明显趋势变化的股标。
The trend indicator is also called the dynamic indicator, and in English it is called the DMI indicator. Its full name is "Directional Movement Index, or DMI for short." It provides a basis for trend judgment by analyzing the changes in the equilibrium point of the power of buyers and sellers during the rise and fall of stock prices, that is, the changes in the power of long and short parties are affected by price fluctuations and occur in a cyclical process from equilibrium to imbalance. technical indicators.
The basic principle of the DMI indicator is to find the function of the stock price to create a new high price or a new low price during the rise and fall of the stock price, to judge the long and short forces, and then to find the equilibrium point between buyers and sellers and the cyclical process of stock price fluctuations under the interaction between the two parties. Among most indicators, most of them calculate different analysis data based on the trend of each day's closing price and the cumulative number of increases and decreases. The disadvantage is that they ignore the difference between the high and low of each day. Fluctuation range. For example, the closing price of a certain stock may be the same on two days, but the fluctuation range is not large on one day, and the amplitude of the stock price is more than 10% on the other day, then the analysis meaning of the market trend on the two days is completely different. This is difficult to show in most other indicators. The DMI indicator takes into account the daily high and low fluctuation factors, so as to more accurately reflect the market trend and better predict the future development and changes of the market.
Indicator Characteristics: It can accurately reflect the market trend and better predict the future development and changes of the market. It is suitable for various short, medium and long time periods, especially for stocks with obvious trend changes.
指标说明 Indicator Description

指标说明请观看我们的Youtube频道。For Indicator Description, please watch our YouTube channel.
https://youtu.be/oBIuk4g2fDA
应用法则 Application Rules
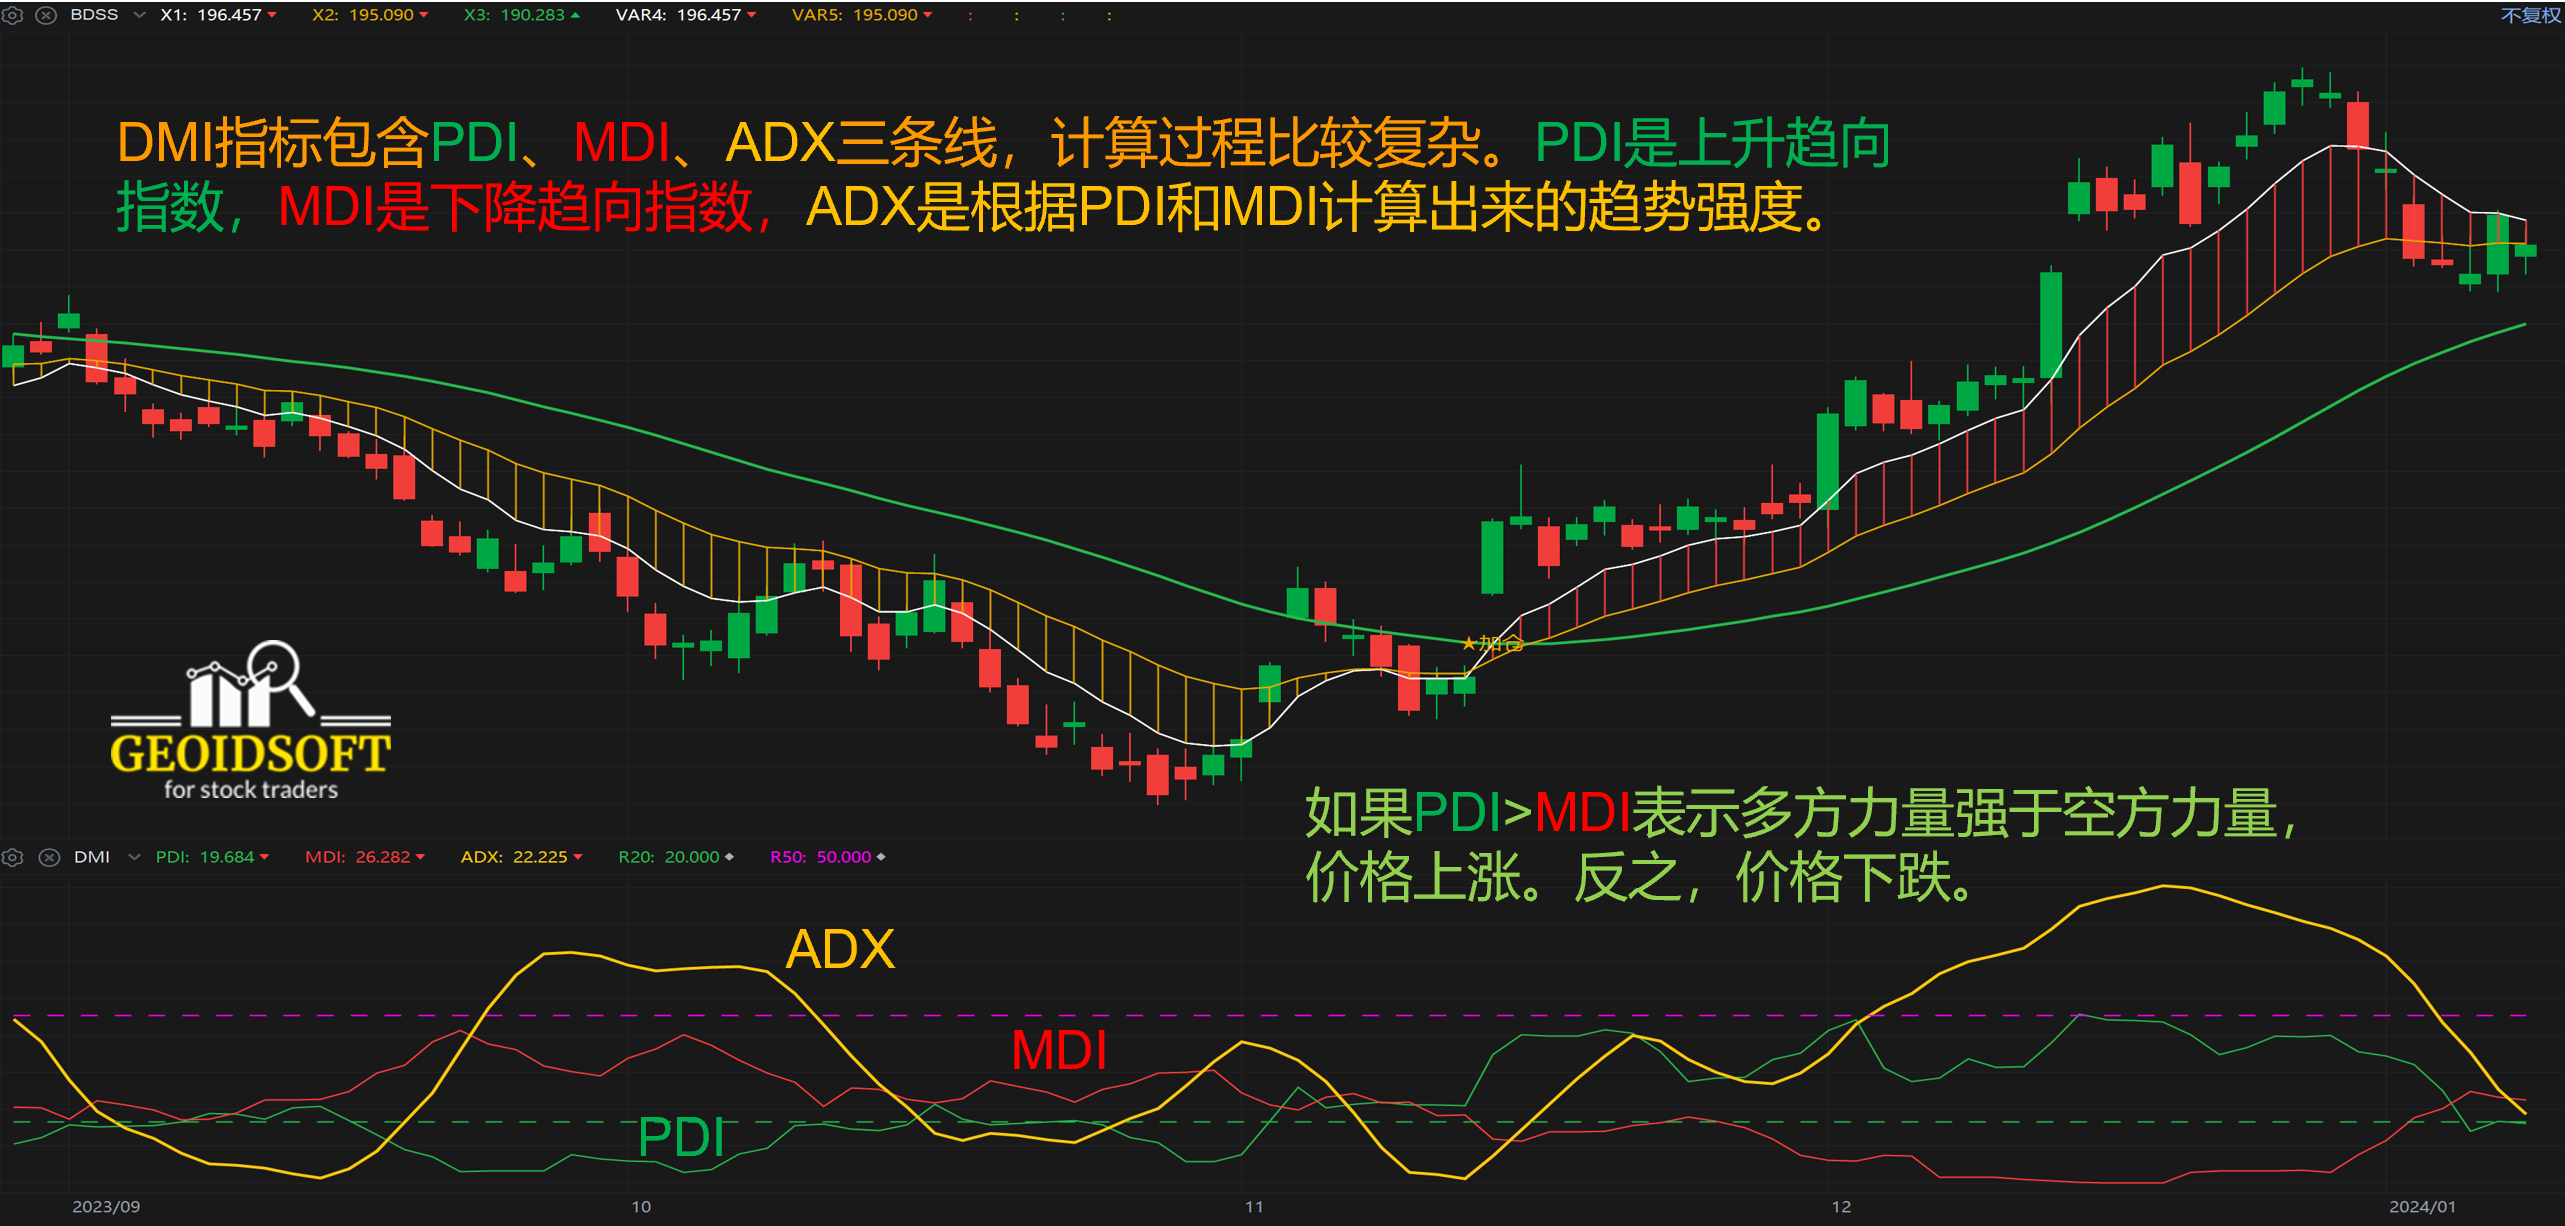
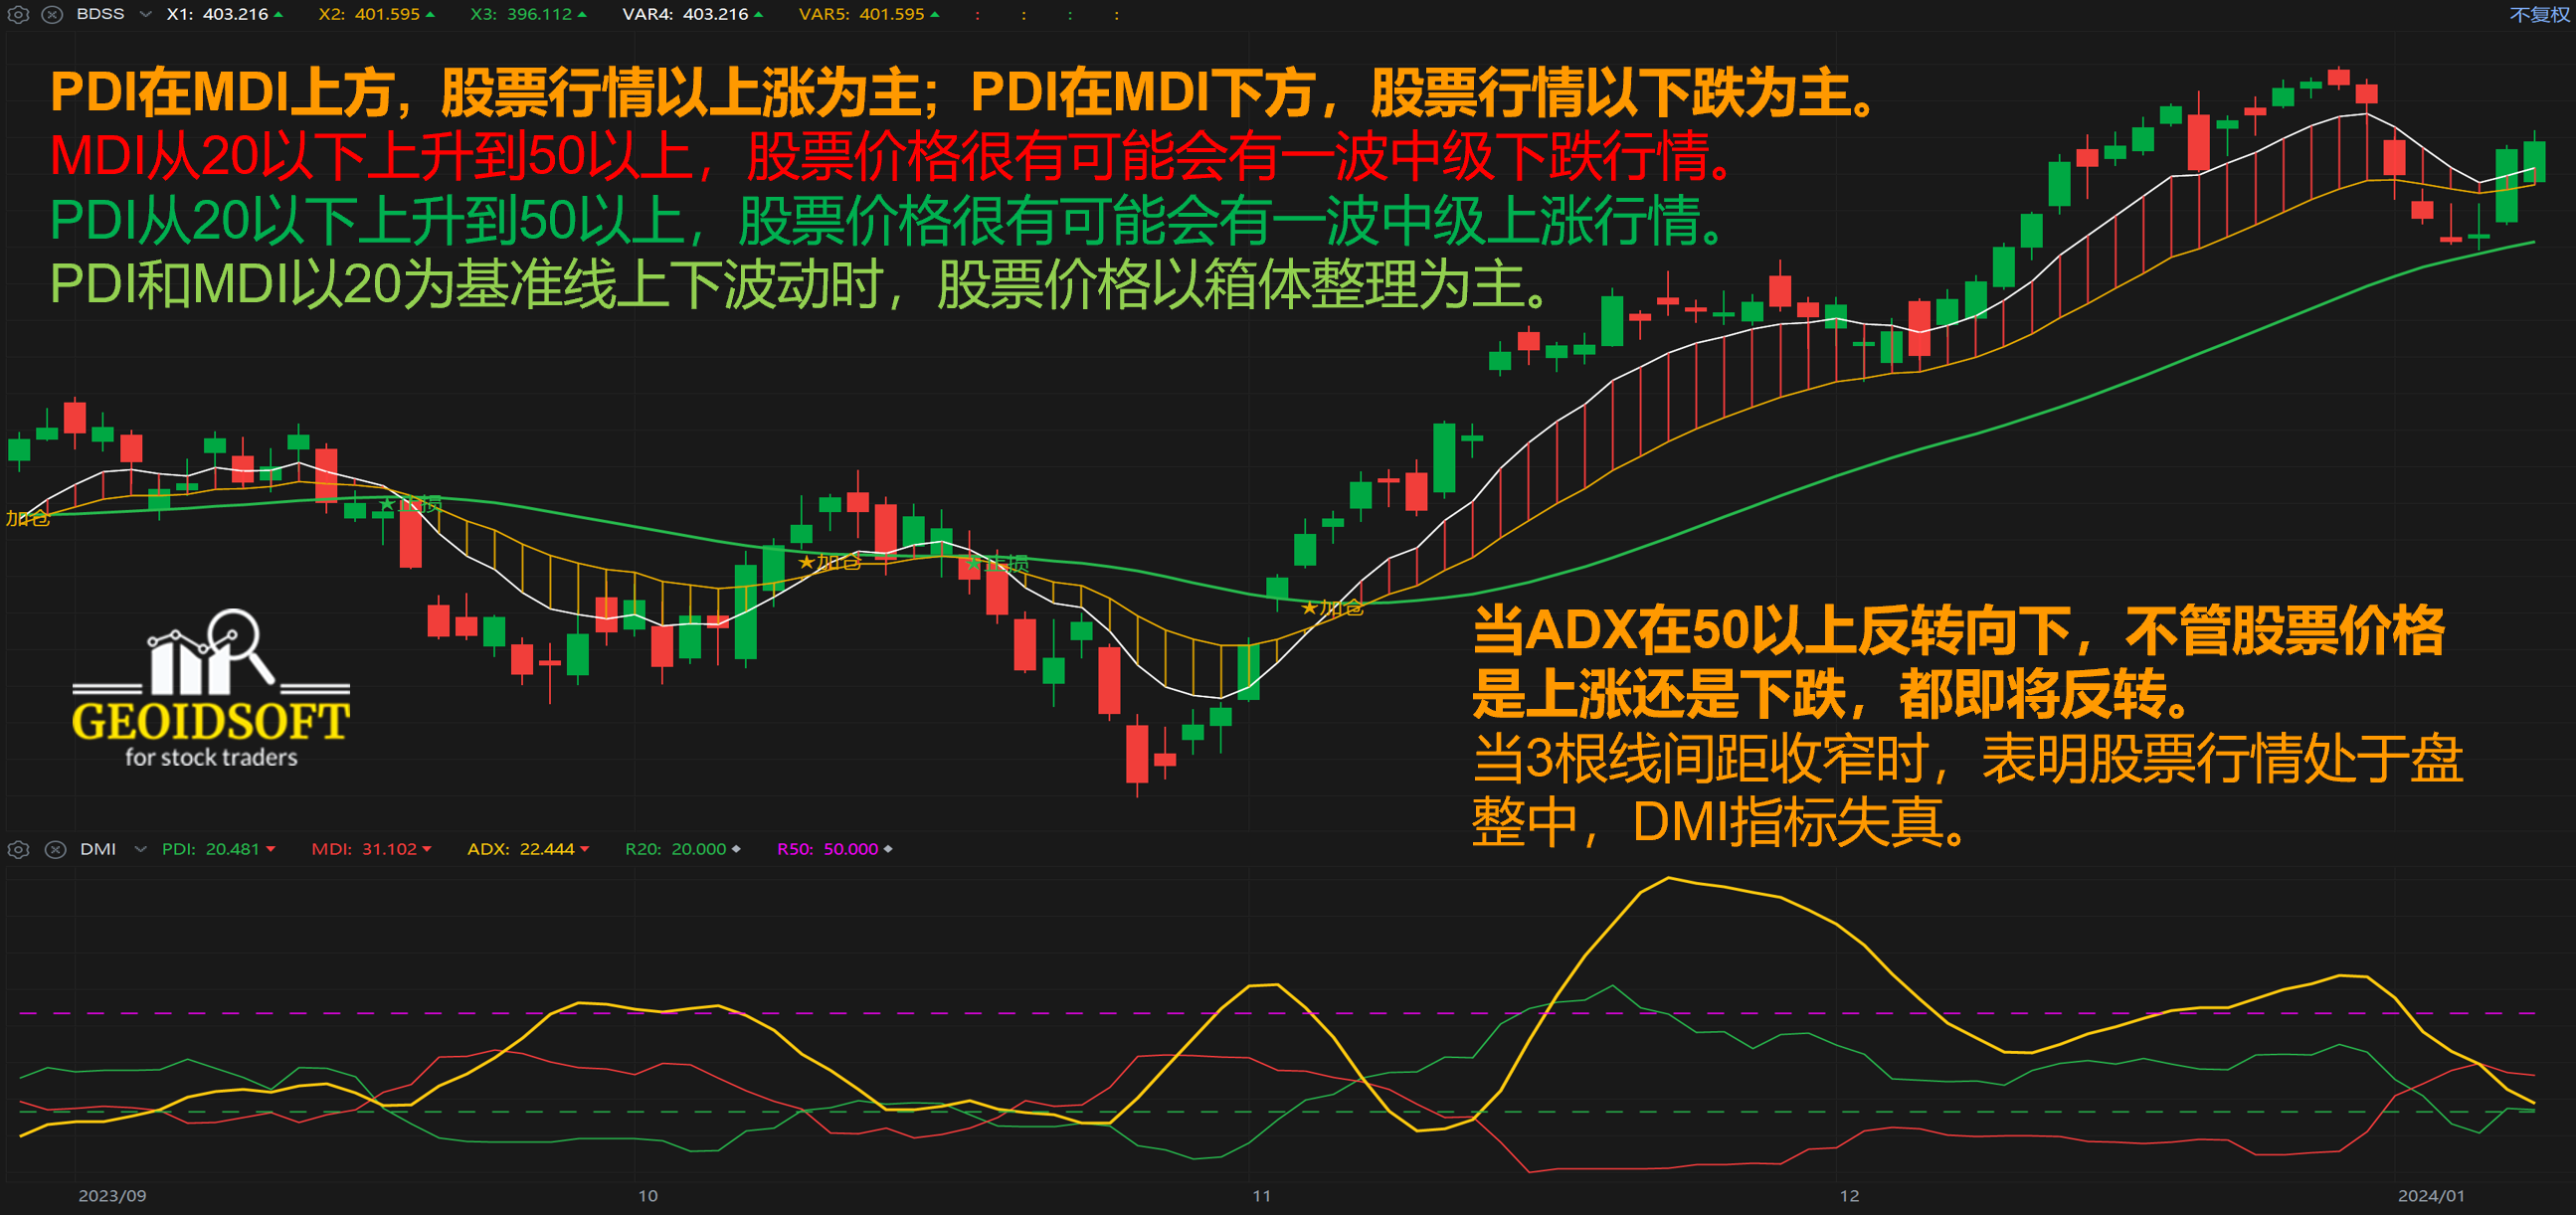
- PDI在MDI上方,股票行情以上涨为主;PDI在MDI下方,股票行情以下跌为主。
- 在股票价格上涨行情中,当PDI向上交叉MDI,是买进信号,相反,当PDI向下交叉MDI,是卖出信号。
- MDI从20以下上升到50以上,股票价格很有可能会有一波中级下跌行情。
- PDI从20以下上升到50以上,股票价格很有可能会有一波中级上涨行情。
- PDI和MDI以20为基准线上下波动时,该股票多空双方拉锯战,股票价格以箱体整理为主。
- 当ADX在50以上反转向下,不管股票价格是上涨还是下跌,都即将反转。
- 当3根线间距收窄时,表明股票行情处于盘整中,DMI指标失真。

应用范例 Application Example
应用范例请观看我们的Youtube频道。For application examples, please watch our YouTube channel.
https://youtu.be/oBIuk4g2fDA

适用范围 Scope of Application
趋向运动特色指标适合各种时间周期。It is suitable for different time periods.
建议作为趋势变化和确定买卖点的观察指标, 结合其他指标进行综合分析观察,构建更有效的操盘系统, 帮助您进行操盘决策。
It is recommended to be used as an auxiliary indicator to understand the strength and weakness of the trend, combined with other indicators for comprehensive analysis and observation, to build a more effective trading system, and to help you make trading decisions.
注意事项 Precautions
指标的计算结果与预设的参数有关。可以根据不同的股票波动特性进行优化和调整, 以便达到最佳效果。
The calculation result of the indicator is related to the preset parameters. It can be optimized and adjusted according to different stock volatility characteristics in order to achieve the best effect.
分析方法
DMI指标的一般分析方法主要是针对PDI、MDI、ADX等三值之间的关系展开的,而在大多数股市技术分析软件上,DMI指标的特殊研判功能则主要是围绕PDI线、MDI线、ADX线和ADXR线等四线之间的关系及DMI指标分析参数的修改和均线先行原则等这三方面的内容而进行的。
1、当PDI线同时在ADX线和ADXR线及MDI线以下(特别是在50线以下的位置时),说明市场处于弱市之中,股市向下运行的趋势还没有改变,股价可能还要下跌,投资者应持币观望或逢高卖出股票为主,不可轻易买入股票。这点是DMI指标研判的重点。
2、当PDI线和MDI线同处50以下时,如果PDI线快速向上突破MDI线,预示新的主力已进场,股价短期内将大涨。如果伴随大的成交量放出,更能确认行情将向上,投资者应迅速短线买入股票。
3、当PDI线从上向下突破MDI线(或MDI线从下向上突破PDI线)时,此时不论PDI和PDI处在什么位置都预示新的空头进场,股价将下跌,投资者应短线卖出股票或以持币观望为主。
4、当PDI线、MDI线、ADX线和ADXR线等四线同时在50线以下绞合在一起窄幅横向运动,说明市场处于波澜不兴,股价处于横向整理之中,此时投资者应以持币观望为主。
5、当PDI线、ADX线和ADXR线等三线同时在50线以下的位置,而此时三条线都快速向上发散,说明市场人气旺盛,股价处在上涨走势之中,投资者可逢低买入或持股待涨。(这点中因为MDI线是下降方向线,其对上涨走势反应不灵,故不予以考虑)。
6、对于牛股来说,ADX在50以上向下转折,仅仅回落到40—60之间,随即再度掉头向上攀升,而且股价在此期间走出横盘整理的态势。随着ADX再度回升,股价向上再次大涨,这是股价拉升时的征兆。这种情况经常出现在一些大涨的牛股中,此时DMI指标只是提供一个向上大趋势即将来临的参考。在实际操作中,则必须结合均线系统和均量线及其他指标一起研判。


