指标特色与说明 Indicator Features and Description
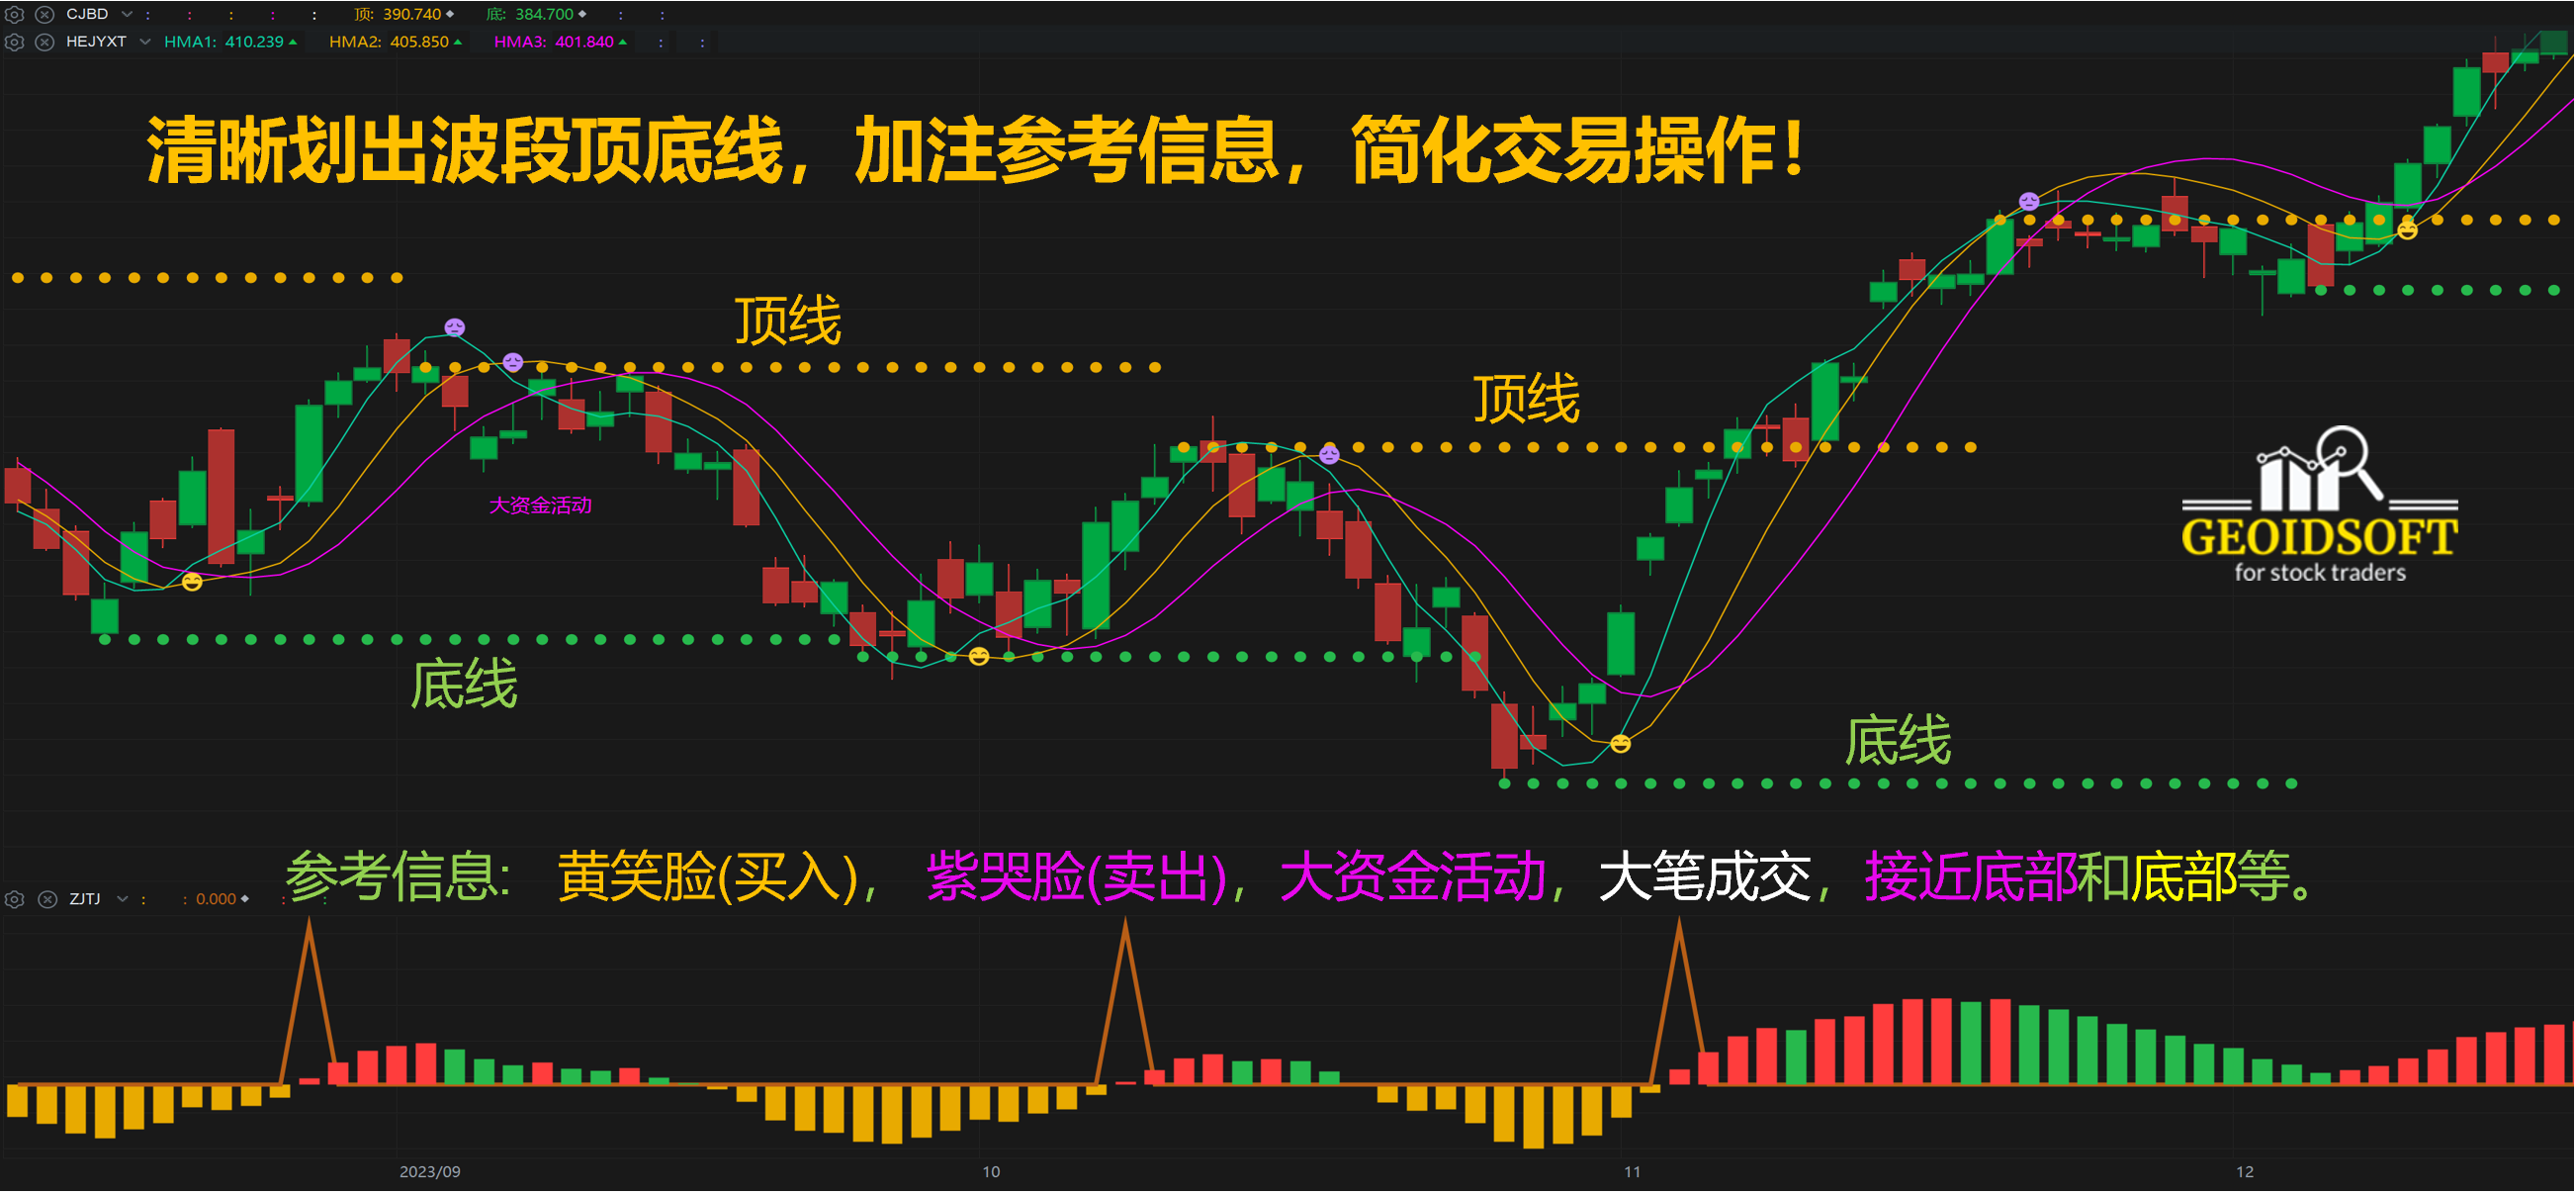
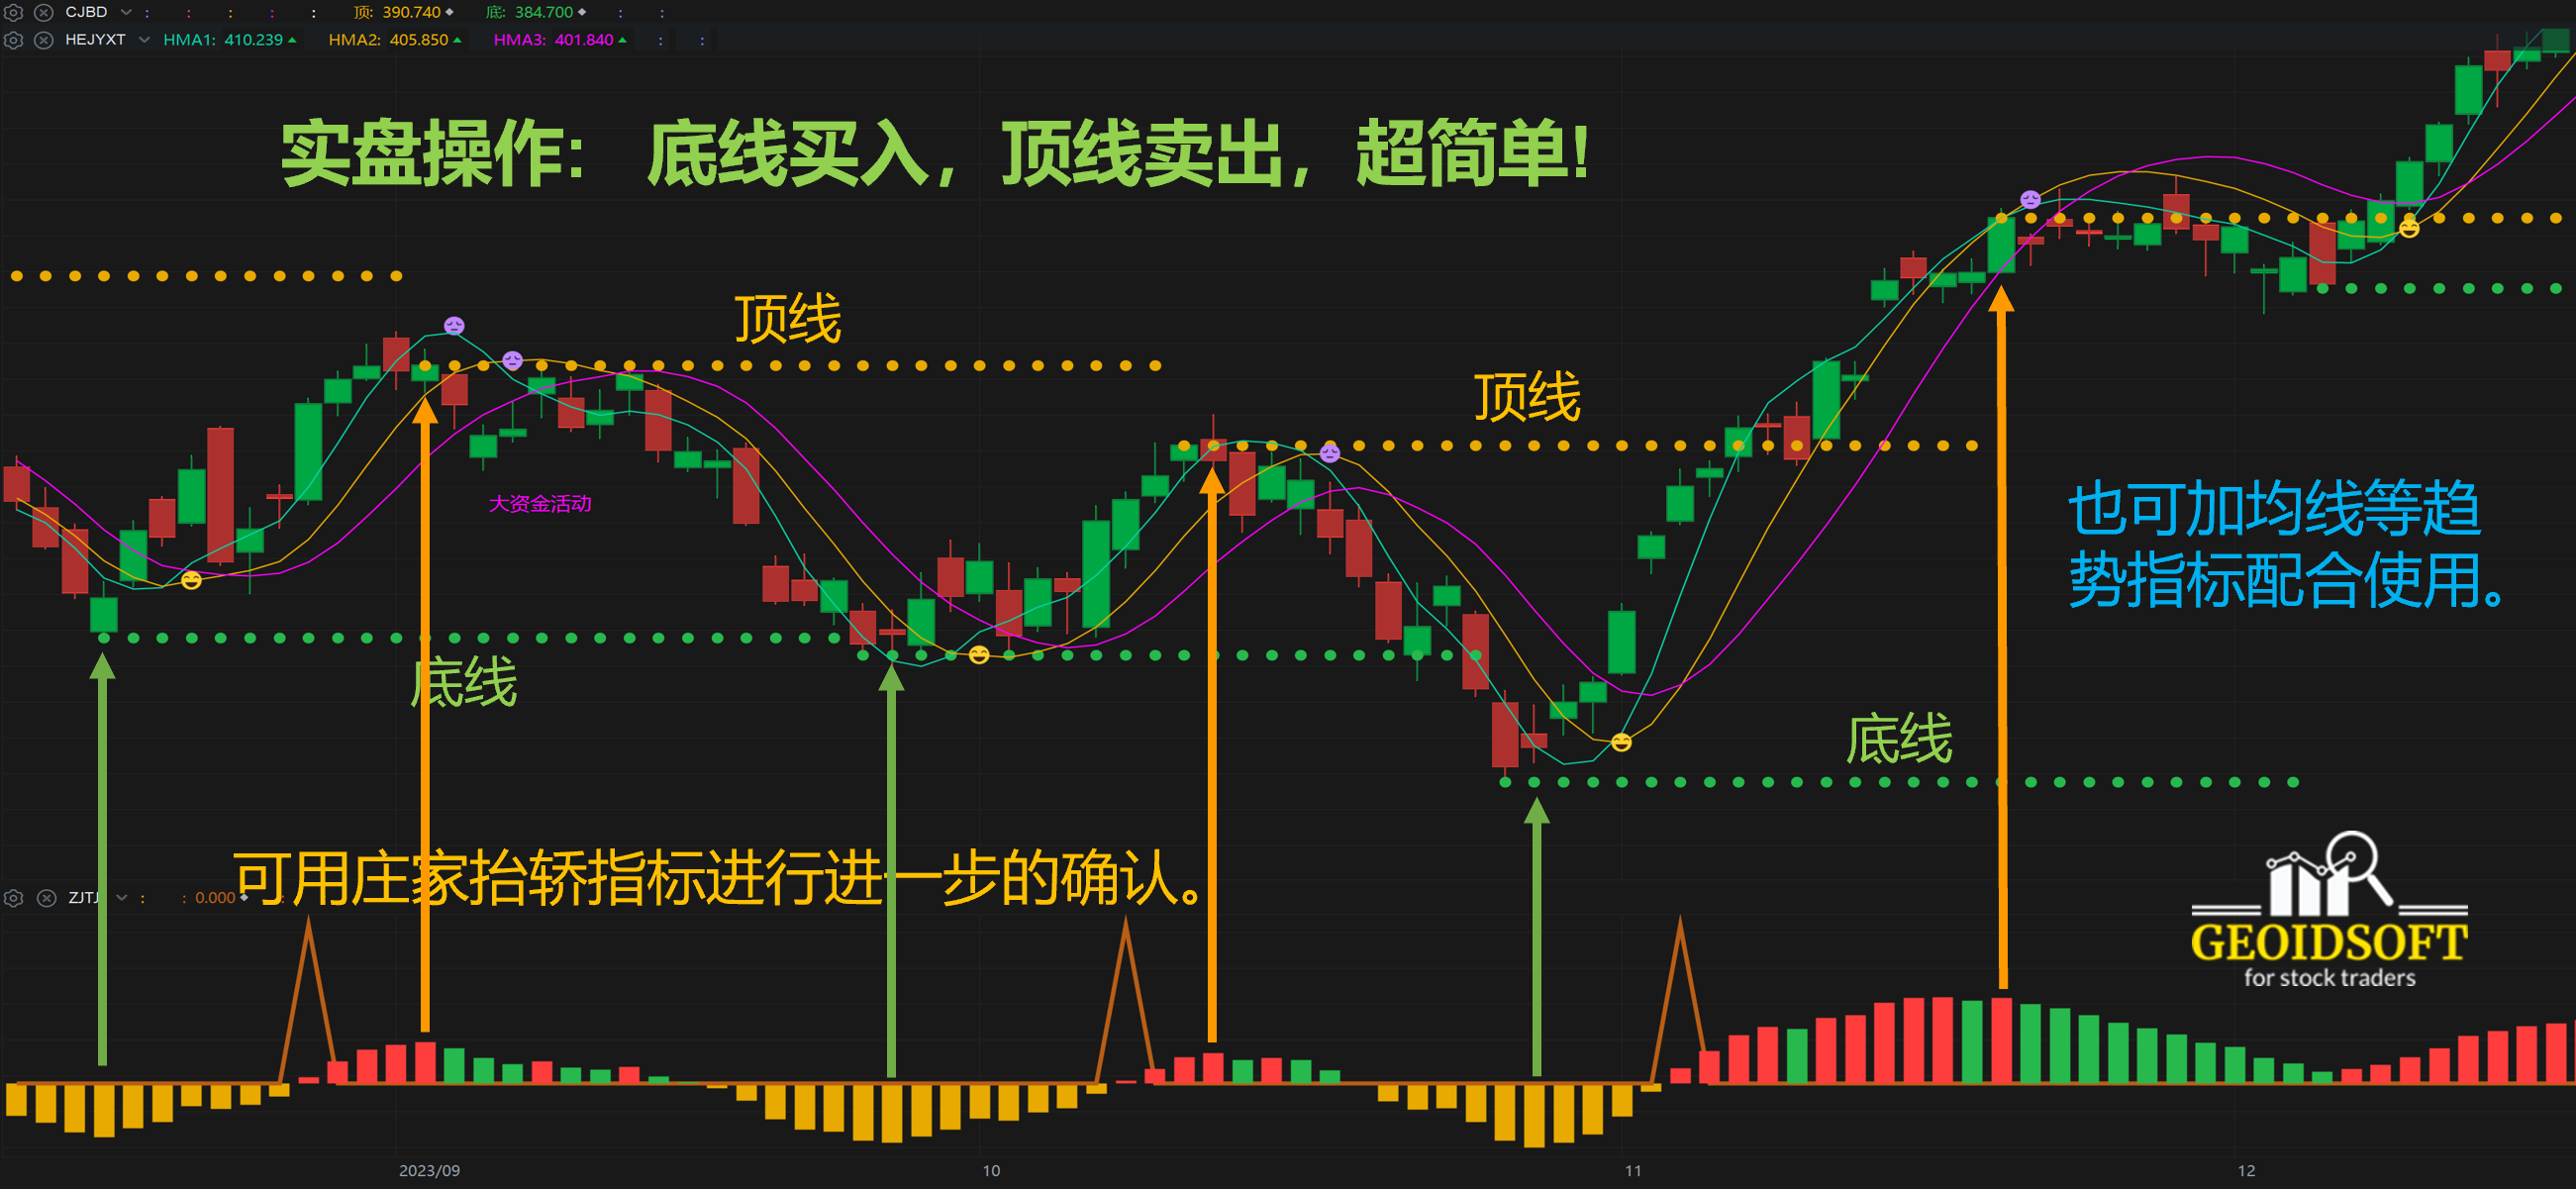
超级波段特色指标是一个采用两根表示顶和底的水平线,将股价的相对高位和低位清晰地标示出来构建的一个简单,实用而且容易操作的特色指标 (见下图)。它让投资者在底线买入,在顶线卖出,使交易的过程简化。
The Super Waveband characteristic indicator is a simple, practical and easy-to-operate indicator that uses two horizontal lines representing tops and bottoms to clearly mark the relative highs and lows of the stock price (see the figure below). It allows investors to buy at the bottom line and sell at the top line, simplifying the trading process.
应用法则 Application Rules
应用范例 Application Examples
应用范例请观看我们的Youtube频道。For application examples, please watch our YouTube channel.
https://youtu.be/ECnkGQAFKLQ
建议作为趋势变化和确定买卖点的观察指标, 结合其他指标进行综合分析观察,构建更有效的操盘系统, 帮助您进行操盘决策。
It is recommended as an observation indicator for trend changes and determination of buying and selling points, combined with other indicators for comprehensive analysis and observation, to build a more effective trading system, and to help you make trading decisions.

