指标特色 Indicator Features
四色K线指标将股票价格运行变化的四种状态用不同的颜色表示出来,让投资者快速了解当前的价格变化状态。
The four-color K-line indicator displays the four states of stock price changes in different colors, allowing investors to quickly understand the current price state.
指标原理 Indicator Principle
四色K线表示的是发明者彭登先生根据价格运行的全过程,结合中国周易阴阳循环理论,归纳出来的四种状态:
1 单边上涨状态
2 单边下跌状态
3 多头状态下的多空分歧状态
4 空头状态下的多空分歧状态
The four-color K-line represents the following four states summarized by the inventor Mr. Peng Deng based on the whole process of price changes, combined with the Chinese Zhouyi yin-yang cycle theory:
1. State of unilateral rise
2. Unilateral down state
3. The long-short divergence state in the long state
4. The long-short divergence state in the short state
指标说明 Indicator Description
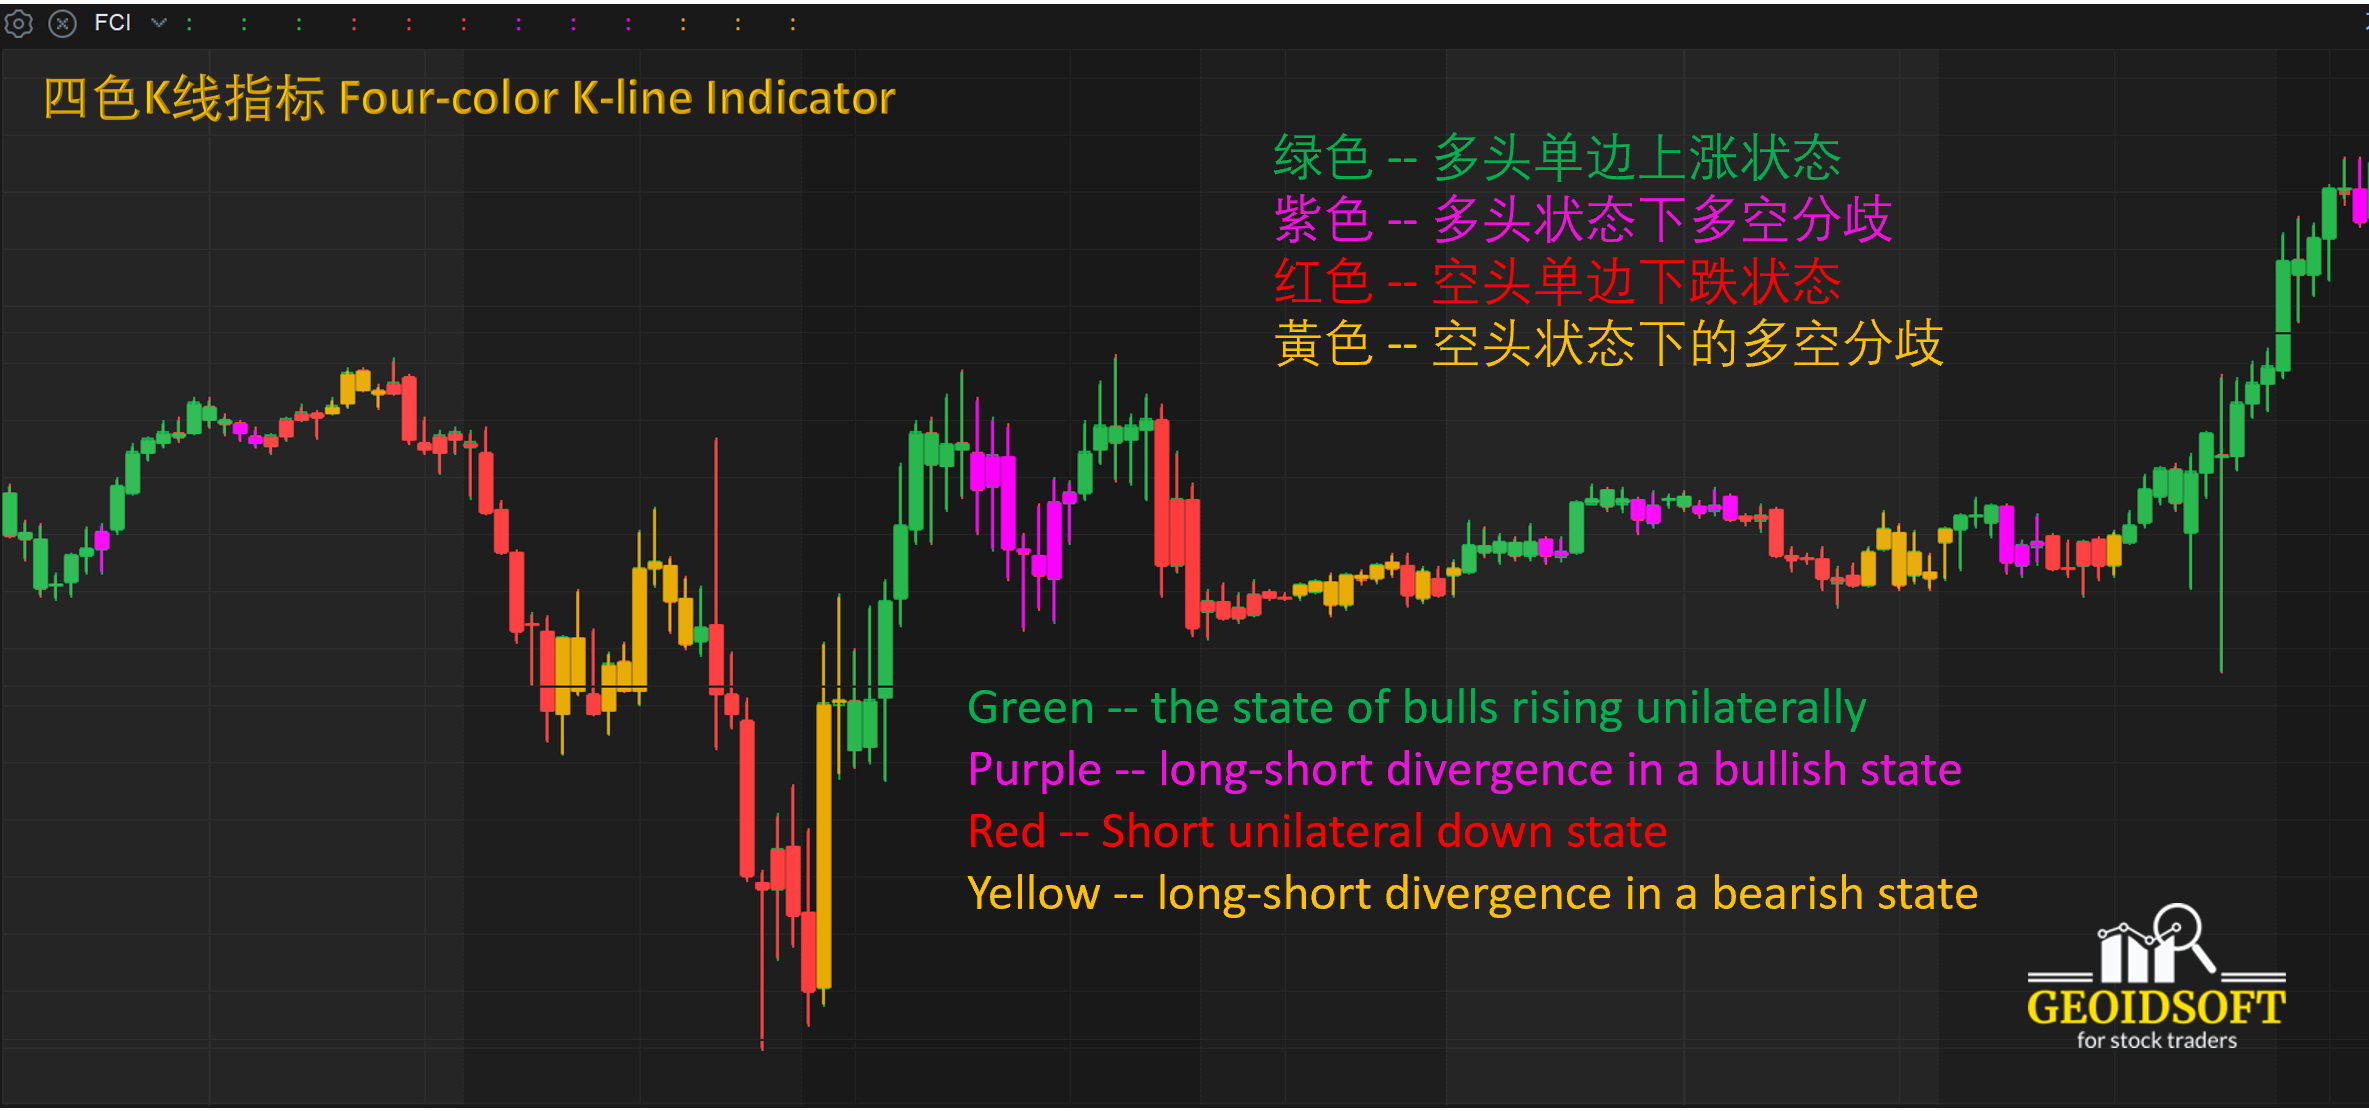
【四色K线】如上图指标,四色K线所用的四种颜色所表示的四种状态是:
1. 绿色 -- 多头单边上涨状态
2. 紫色 -- 多头状态下多空分歧
3. 红色 -- 空头单边下跌状态
4. 黃色 -- 空头状态下的多空分歧
The four states represented by the four colors used by the four-color K-line are:
1. Green -- the state of bulls rising unilaterally
2. Purple -- long-short divergence in a bullish state
3. Red -- a unilateral decline in short positions
4. Yellow -- long-short divergence in a bearish state
应用法则 Application Rules
通过下面四种价格运行状态下的八种颜色变换了解和掌握市场的真实状态。
Understand and grasp the real state of the market through eight color changes in the following four price operation states.
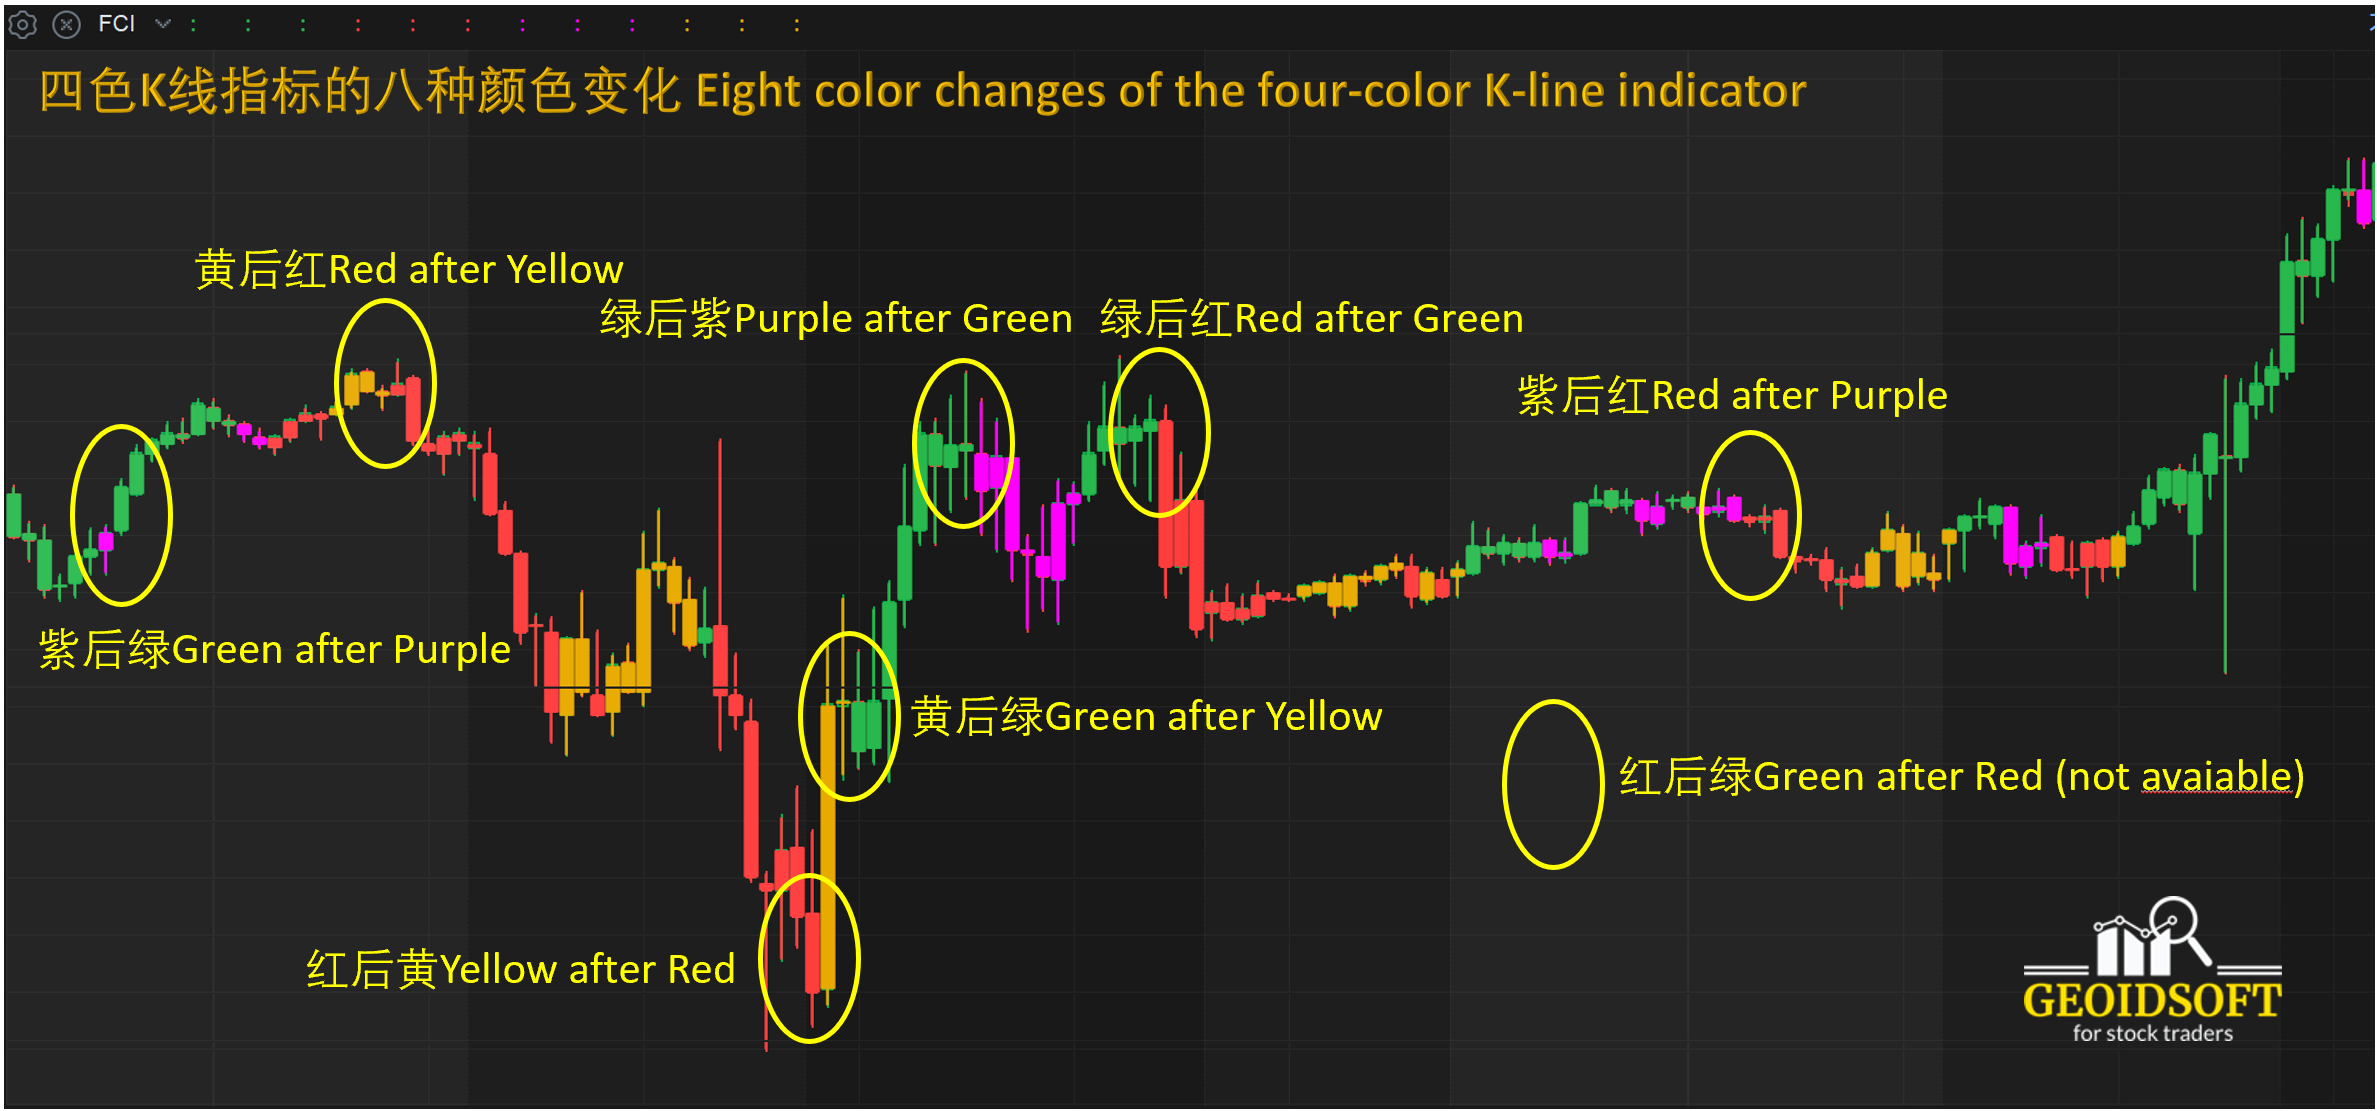
| 序号 | 颜色变化状态 | 对应阴阳变化状态 | 含义 |
| 1 | 黄后绿Green after yellow | 阴极后阳初 | 多头状态Bull status |
| 2 | 绿后紫Purple after Green | 阳初后阳极 | 多头减弱The bulls weaken |
| 3 | 紫后红Red after Purple | 阳极后阴初 | 空头状态Short state |
| 4 | 红后黄Yellow after Red | 阴初后阴极 | 空头减弱Short position weakens |
| 5 | 紫后绿Green after Purple | 阳极后阳初 | 上涨中继Rising Relay |
| 6 | 黄后红Red after Yellow | 阴极后阴初 | 下跌中继Falling Relay |
| 7 | 绿后红Red after Green | 多翻空 | 进入空头状态Entering short state |
| 8 | 红后绿Green after Red | 空翻多 | 进入多头状态Entering long state |
应用范例请观看我们的Youtube频道。For application examples, please watch our YouTube channel.
https://youtu.be/eVDOSGfnLyE
适用范围 Scope of Application
四色K线指标适合各种周期的盘面,从长期趋势的“年线”、“季线”和“月线”图,以及中期趋势的“周线”和“日线”图,甚至短期趋势的“小时”及“分钟”图,均可直观地观察当时的价格运动变化。
The four-color K-line indicator is suitable for various time cycles of the market, from the long-term trend "annual line", "seasonal line" and "monthly line" charts, as well as the medium-term trend "weekly line" and "daily line" charts, and even the "hour" and "minute" charts of the short-term trend. It shows visually the price movement changes at that time.
建议作为背景了解价格运动变化, 结合其他指标进行综合分析观察,构建更有效的操盘系统, 帮助您进行操盘决策。
It is recommended to use this indicator for understanding the price movement changes in the market as a background, and conduct comprehensive analysis and observation in combination with other indicators to build a more effective trading system that will help you make trading decisions.
注意事项 Precautions
指标的计算结果与一些预设的参数有关。可以根据自己习惯的操盘周期进行优化和调整, 以便达到最佳效果。
The calculation result of the indicator is related to some preset parameters. It can be optimized and adjusted according to the trading cycle you are used to in order to achieve the best results.

