系统简介 System Introduction
多指标综合操盘系统-V1是我们偿试的第二个操盘系统,也是前面介绍过的波段趋势超短线操盘系统的升级版。它由三个主图指标和多个副图指标集合而成。主图指标包括四色K线指标,彩色波段趋势指标和神奇三均线指标。副图指标包括六彩神龙标, MACD与RSI共振指标, MACD风云彩带指标, OBV能量潮指标和六指金叉共振指标等。系统适用于各种时间周期的选股和行情分析,包括以不同时间周期为基础的超短线日内盯盘操作 , 但要求交易的股票必须有足够的成交量, 以保证系统的稳定和交易效果。
Multi-indicator comprehensive trading system-V1 is the second trading system we have tried, and it is also an upgraded version of the wave trend ultra-short-term trading system introduced earlier. It consists of three main chart indicators and multiple sub-chart indicators. The main chart indicators include four-color K-line indicators, color band trend indicators and magical three-way moving average indicators. The sub-chart indicators include the six-color dragon indicator, the MACD and RSI resonance indicator, the MACD indicator, the OBV energy tide indicator, and the six-indices golden cross resonance indicator. The system is suitable for stock selection and market analysis of various time periods, including ultra-short-term day trade operations based on different time periods, but the stocks to be traded must have sufficient trading volume to ensure the stability of the system and the trading effect.
应用说明 Application Note
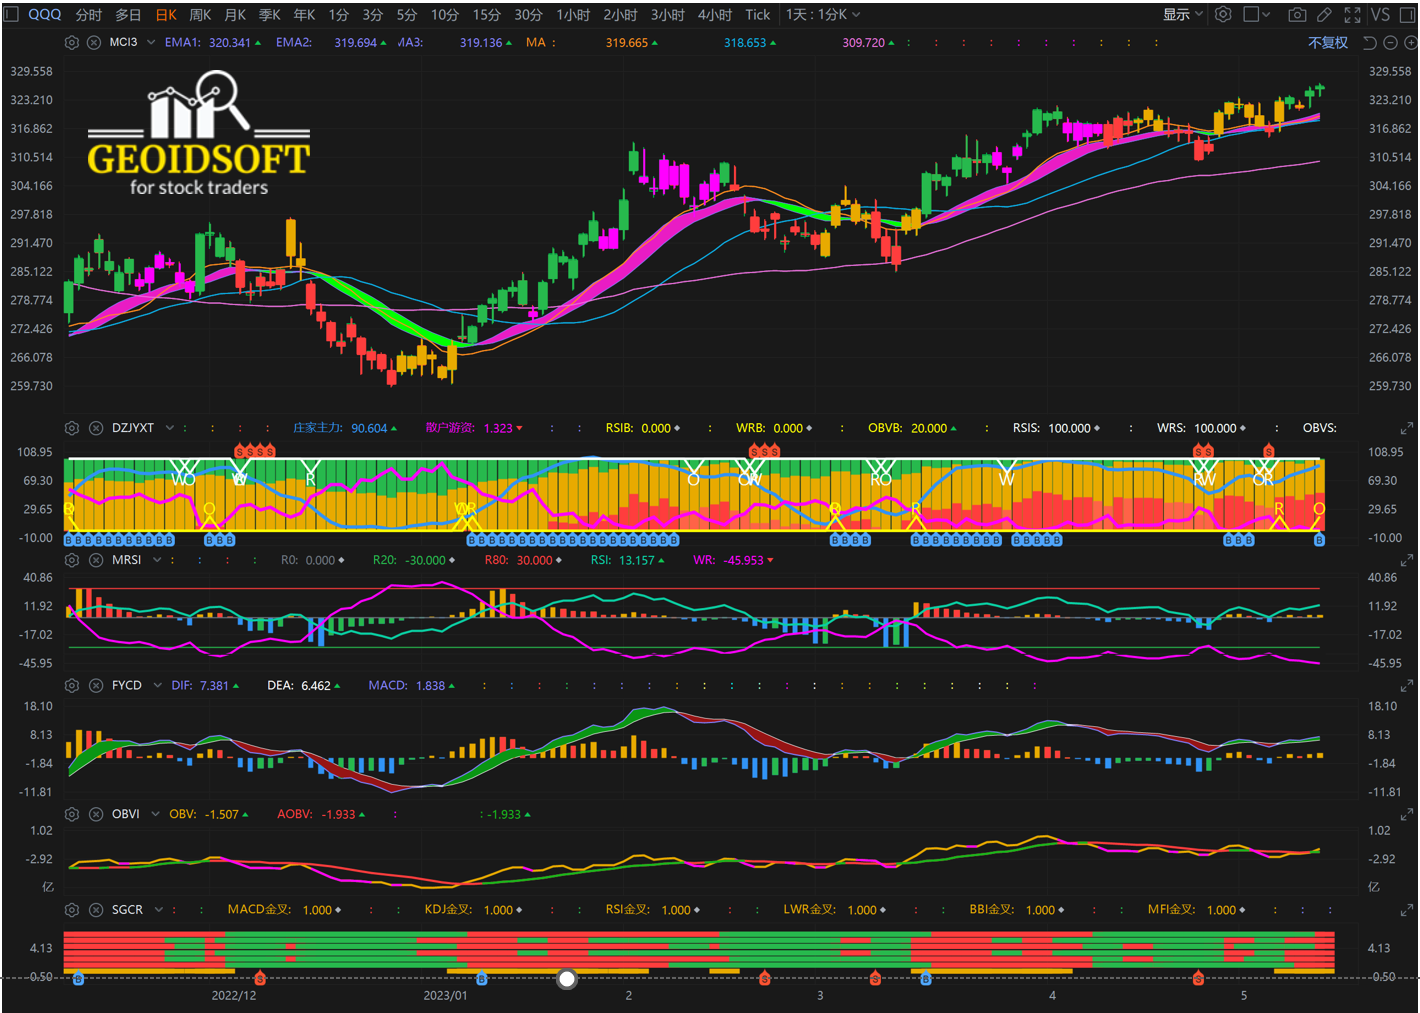
如上图所示,多指标综合操盘系统-V1采用了三个主图指标,即四色K线指标,彩色波段趋势指标和神奇三均线指标来显示目前市场的价格和趋势变化。当K-线位于彩色波带之上时为多头趋势,反之为空头趋势。
As shown in the figure above, the multi-indicator comprehensive trading system-V1 uses three main chart indicators, namely the four-color K-line indicator, the color band trend indicator and the magic three-way moving average indicator to display the current market price and trend changes. When the K-line is above the colored band, it is a long trend, otherwise it is a short trend.
重要的交易信号体显在以六彩神龙为背景的副图指标DZJYXT上. 这一指标上的蓝色粗线表示主力交易的趋势线,80以上表示主力在主导交易,20以下主要是散户在交易。根据多种指标确定的交易信号包括”W”,”R" 和 ”O"也将标示在这一副图指标上。其中, ”W” 表示由MACD和WR指标共振产生的买卖信号,”R" 表示由MACD和RSI指标共振产生的买卖信号,”O" 表示由MACD和OBV指标共振产生的买卖信号。如果交易信号(”R”, ”O”或”W“)出现在底部为买入信号,出现在顶部为卖出信号。MACD与RSI和OBV指标共振时出现的买入信号加注“B”符号表示买入,同样地,MACD与RSI和OBV指标共振时出现的卖出信号加注“S”符号表示卖出。因此,通常见“B”符号买入,见“S”符号卖出。
Important trading signals are displayed on the sub-chart DZJYXT indicator with the six-colored dragon as the background. The blue thick line on this indicator indicates the trend line of the main force trading. Above 80 means that the main force is leading the trades, and below 20 means that the trades are conducted mainly by retail investors. The trading signals based on various indicators including "W", "R" and "O" will be marked on this sub-chart indicator too. Among them, "W" represents the buying and selling signal generated by the resonance of MACD and WR indicators, "R" represents the buying and selling signal generated by the resonance of MACD and RSI indicators, and "O" represents the buying and selling signal generated by the resonance of MACD and OBV indicators. If the trading signal ("R", "O" or "W") appears at the bottom it is a buy signal and at the top it is a sell signal. When the MACD resonates with the RSI and OBV indicators, a "B" symbol is added to indicate the buy signal. Similarly, the "S" symbol is added to the sell signal when the MACD resonates with the RSI and OBV indicators to indicate the sell. Therefore, you usually see the "B" symbol to buy and the "S" symbol to sell.
应用法则 Application Rules
基本的应用规则:
基本的应用规则是等待交易信号(”R”, ”O”或”W“)出现,出现在底部为买入信号,出现在顶部为卖出信号。当MACD与RSI和OBV共振时会出现买入“B”和卖出“S”符号。通常见“B”符号买入,见“S”符号卖出。买入后,“B”符号之间可持股观察, “B"消失, 不一定马上卖,但要随时准备卖出。一个成功的交易是当交易信号出现时,及时地验证各种指标是否同步指向或者共振,如果是,可大胆果断地执行交易。如果多个指标信号不明或者相互矛盾,则不操作,等待下次信号。如果大部分指标同步共振,一个或二个指标信号不明,可酌量执行交易。
The basic rule of application is to wait for a trading signal ("R", "O" or "W") to appear, which appears at the bottom as a buy signal and at the top as a sell signal. Buy "B" and sell "S" symbols appear when MACD resonates with RSI and OBV. Usually see the "B" symbol to buy, see the "S" symbol to sell. After buying, you can hold shares and observe between the "B" symbols. When "B" disappears, you may not sell immediately, but you must be ready to sell at any time. A successful transaction (buy or sell) is to promptly verify whether various indicators point to or resonate synchronously when a transaction signal appears, and if so, execute the transaction boldly and decisively. If multiple indicator signals are unclear or contradictory, do not operate and wait for the next signal. If most of the indicators resonate synchronously and one or two indicators are unclear, the transaction can be executed at discretion.
买入信号验证:
1. 三均线是否趋势向上或者有拐头向上之势。
2. 波段趋势是否趋势向上或者正在拐头向上。
3. 六彩神龙显示套牢盘在减少,蓝色主力线趋势向上。
4. RSI有望或正在上穿零轴并且MACD>0。
5. MACD呈现上涨趋势。
6. OBV线有望或正在上穿OBV均线。
7. 六指金叉共振指标进入共振。
8. 如果所有这些指示信号明确同步,则大胆买入,但要控制在一个合适的仓位。
9. 如果不完全同步,可继续观察或少量买入或不操作。
卖出验证:
1. 三均线是否趋势向下或者有拐头向下之势。
2. 波段趋势是否向下或者正在拐头向下。
3. 六彩神龙显示套牢盘在增加, 蓝色主力线趋势向下跌破90。
4. RSI正在下穿零轴并且MACD<0。
5. MACD呈现下跌趋势。
6. OBV线正在下穿OBV均线。
7.六指金叉共振指标脱离共振。
8. 如果所有这些指示信号明确同步,则果断清仓卖出。
9. 如果出现“S“符号一定要小心,时刻准备清仓卖出,控制风险。
运用多种买卖模型,取长补短:
1. 神奇均线三步确定拉升点的方法
2. 波段趋势转折买卖模型
3. 六指金叉共振买卖模型
4. MACD神龙买卖模型
5. MACD主力能量买卖模型
6. MACD与RSI共振买卖模型
7. MACD与WR共振顶底模型
8. OBV主力拉升预判方法
9. OBV抄底掘金术
10. OBV逃顶避险术
应用范例 Application Examples
应用范例请观看我们的Youtube频道。For application examples, please watch our Youtube channel.
https://youtu.be/JlWvTaxxk7M
https://youtu.be/vVOs-kr3bhk

https://youtu.be/6n53HUxtJg0
适用范围 Scope of Application
多指标综合操盘系统-V1适合各种周期的盘面,对于长期趋势的“年线”、“季线”和“月线”图,以及中期趋势的“周线”和“日线”图,可以用它来做目前股市状态分析。对于短期趋势的“小时”及“分钟”图,可以用它来做日内交易操盘。建议以三分钟盘面作为基本盘,其它时间周期的盘面作为趋势复核,提高每笔交易的正确判断。注意:一分钟盘面显示的价格变化过于频繁,不宜作交易盯盘。一旦出现了交易信号,用它来帮助确定一个比较好的交易点是有帮助的。
The Multi-indicator comprehensive trading system-V1 is suitable for various time cycles of the market. For the "annual line", "seasonal line" and "monthly line" charts of long-term trends, as well as the "weekly line" and "daily line" charts of medium-term trends, you can use it to analyze the current state of the stock market. For the "hour" and "minute" charts of short-term trends, it can be used for intraday trading. It is recommended to use the three-minute chart for intraday trading, and the other time periods as a trend review to improve the correct judgment of each transaction. Note: The price changes displayed on the one-minute chart are too frequent, so it is not suitable for trading. Once a trade signal appears, it is helpful to use it to identify a good trade point.
注意事项 Precautions
没有一个交易系统能够确保您的每笔交易正确无风险,即使正确买进,不注意盈利的保护,也会导致严重的损失。借助于这一多指标综合操盘系统,能否取得成功,仍然取决于您的交易经验,能够理解股市盘面价格变化并迅速作出判断采取行动的能力。多指标综合操盘系统-V1仅仅能够给您图示化的信息帮助, 帮您作出快揵和更加准确的判断。
There is no trading system that can ensure that each of your transactions is correct and risk-free. Even if you buy correctly, if you don't pay attention to the protection of profits, it will lead to serious losses. With the help of this wave band trend ultra-short-term trading system, whether you can succeed still depends on your trading experience, your ability to understand the price changes on the stock market and quickly make judgments and take actions. The multi-indicator comprehensive trading system-V1 can only give you graphical information to help you make quick and more accurate judgments.
建议投资者在运用这一系统进行实际的操盘之前,首先运用富途软件的模拟交易功能进行足够的练习,待到有盈利能力时再进行实际交易。另外,采用这一系统一定要选择交易量足够大的股票,比如标普500指数和纳斯达克指数相关的ETF产品和大型科技龙头公司的股票,以保证系统的效果和稳定性。
It is recommended that investors use the simulated trading function of Futu software for sufficient practice before using this system for actual trading, and then conduct actual trading when there is profitability. In addition, when using this system, it is necessary to choose stocks with sufficient trading volume, such as ETF products related to the S&P 500 Index and Nasdaq Index, and stocks of leading technology companies to ensure the effectiveness and stability of the system.
观看介绍如何在富途软件上测试或者练习一个操盘系统的YouTube视频 Watch YouTube video that introduces how to test or practice a trading system on Futu software.
自己的投资, 自已决定和自已负责!
Invest yourself, decide and be responsible for yourself!

