系统简介 System Introduction
波段趋势超短线交易系统是我们开发的首个简单,有效,直观实用的操盘系统。它由三个主图指标和多个副图指标集合而成。主图指标包括四色K线指标,彩色波段趋势指标和神奇三均线指标。副图指标包括六彩神龙指标, 六指金叉共振指标, 四色柱指标和多个隐含的选股指标等。特别适用于日内盯盘,以三分钟时间周期为基础的超短线交易者。系统本身适用于各种时间周期,但我们主要测试了三分钟为基础的日内交易。交易的股票应有足够的成交量, 为此我们内设了最小成交量条件,以保证系统的交易效果。
The wave band trend ultra-short-term trading system is the first simple, effective, intuitive and practical trading system developed by us. It consists of three main chart indicators and multiple sub-chart indicators. The main chart indicators include four-color K-line indicators, color band trend indicators and magical three moving average indicators. The sub-chart indicators include six-color dragon indicator, six-indices golden cross resonance indicator, four-color column indicator and multiple implicit stock selection indicators, etc. It is especially suitable for ultra-short-term traders who keep an eye on the market within the day and are based on a three-minute time period. The system itself works on a variety of timeframes, but we primarily tested intraday trading on a three-minute basis. The stocks to be traded should have sufficient trading volume, for which we have set a minimum trading volume condition to ensure the trading effect of the system.
应用说明 Application Note
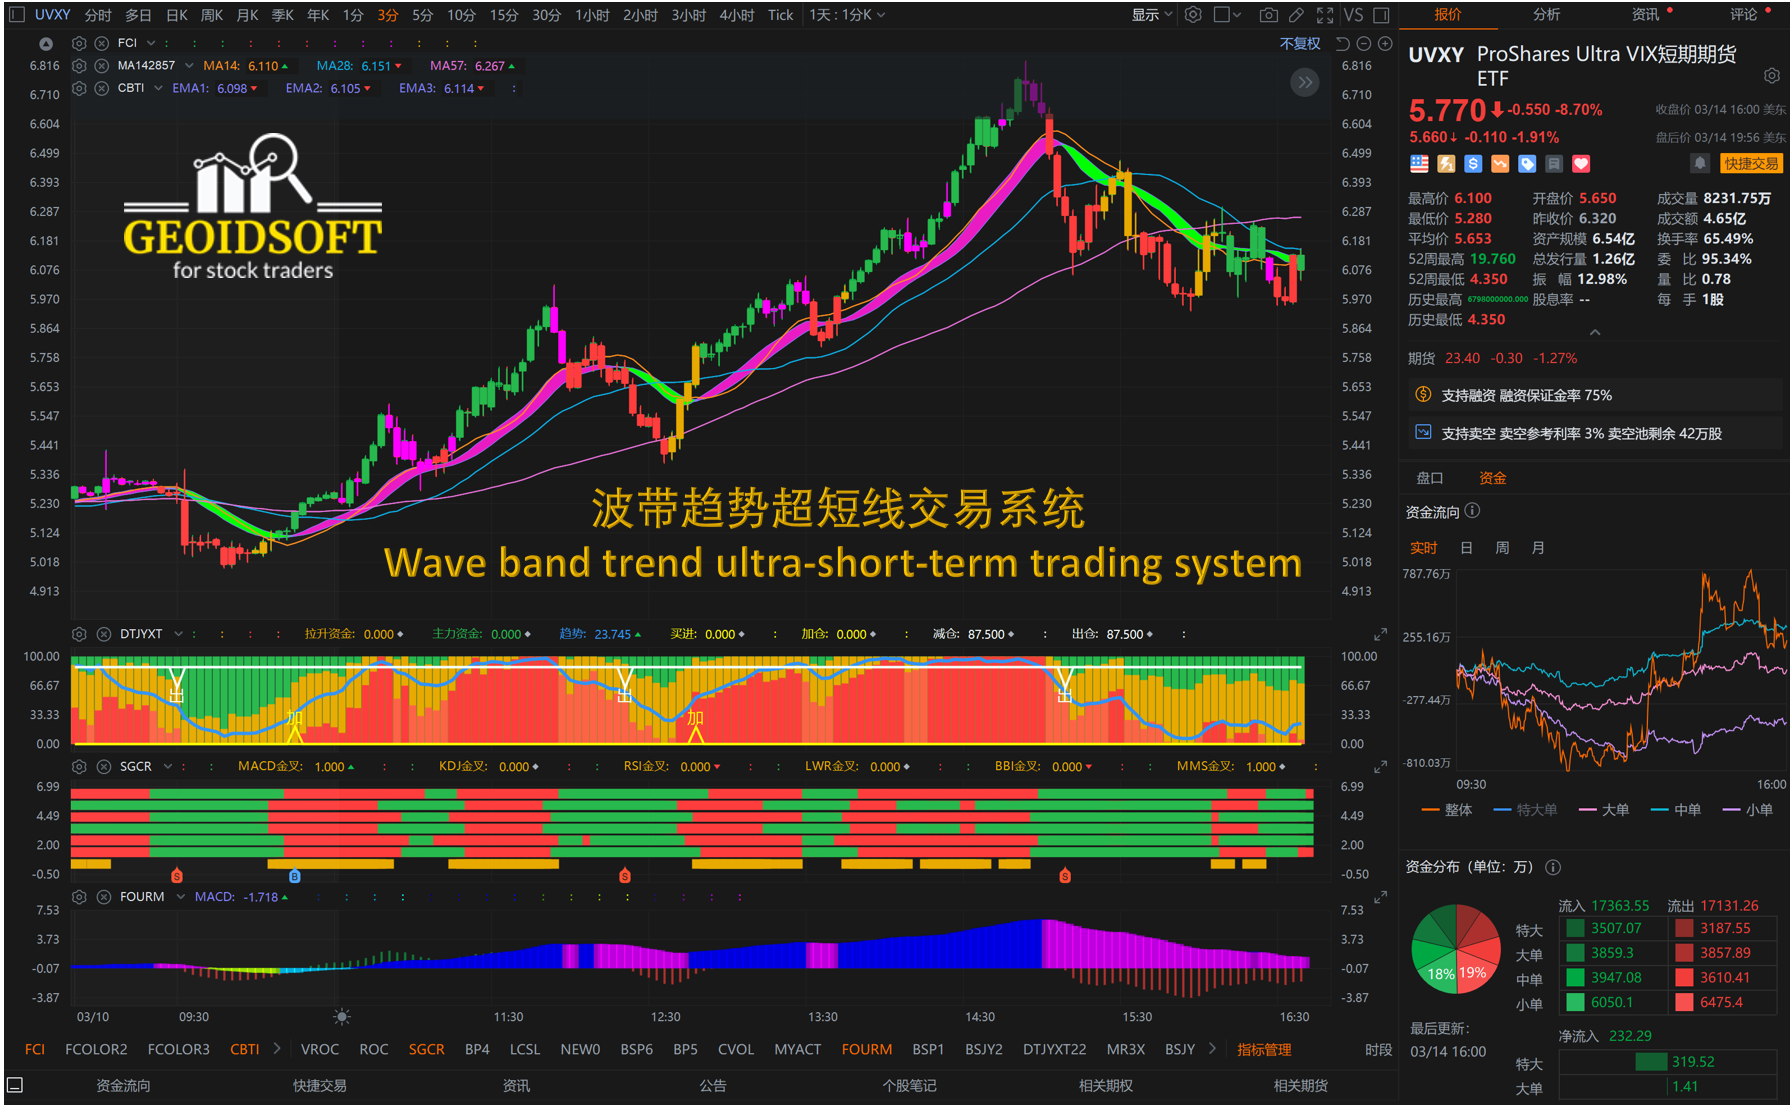
如上图所示,波段趋势超短线交易系统采用了三个主图指标,即四色K线指标,彩色波段趋势指标和神奇三均线指标来显示目前市场的价格和趋势变化。当K-线位于彩色波带之上时为多头趋势,反之为空头趋势。
As shown in the figure above, the band trend ultra-short-term trading system uses three main chart indicators, namely the four-color K-line indicator, the color band trend indicator and the magic three-way moving average indicator to display the current market price and trend changes. When the K-line is above the colored band, it is a long trend, otherwise it is a short trend.
重要的交易信号体显在以六彩神龙为背景的副图指标DTJYXT上. 这一指标上蓝色粗线表示主力交易的趋势线,80以上表示主力在主导交易,20以下主要是散户在交易。根据隐含的多种指标确定的交易信号包括”进”(买进),”加”(加仓),”减"(减仓)和“出”(卖出)也将标示在这一副图指标上。一旦交易信号出现,即可验证其它指标决定是否执行交易。重要的验证指标是二个主图指标,即彩色波段趋势指标和神奇三均线指标, 和三个副图指标,即六彩神龙指标, 六指金叉共振指标和四色柱指标。具体的按下面的应用规则进行验证和操作。
Important trading signals are displayed on the sub-chart indicator DTJYXT with the six-colored dragon as the background. The blue thick line on this indicator indicates the trend line of the main force trading. Above 80 means that the main force is leading the transaction, and below 20 is mainly retail investors. Trading signals based on implied multiple indicators including "In" (buy), "Add" (increase in position), "minus" (decrease in position) and "Out" (sell) will also be marked on this sub-chart indicator. Once the transaction signal appears, other indicators can be verified to decide whether to execute the transaction. The important verification indicators are the two main chart indicators, namely the color band trend indicator and the magical three moving average indicator, and three sub-chart indicators, namely the six-color dragon indicator, the six-indices golden cross resonance indicator and the four-color column indicator. Specifically, verify and operate according to the following application rules.
应用法则 Application Rules
基本的应用规则是等待交易信号(不论买进或卖出)出现,然后验证各种指标是否同步指向或者共振,如果是,可大胆果断地执行交易。如果多个指标信号不明或者相互矛盾,则不操作,等待下次信号。如果大部分指标同步共振,一个或二个指标信号不明,可酌量执行交易。
The basic application rule is to wait for the trading signal (whether buying or selling) to appear, and then verify whether various indicators point to or resonate synchronously, and if so, execute the transaction boldly and decisively. If multiple indicator signals are unclear or contradictory, do not operate and wait for the next signal. If most of the indicators resonate synchronously and one or two indicators are unclear, the transaction can be executed at discretion.
出现"进“或者“加”字均为买入信号, 验证:
1. 主图三均线是否趋势向上或者有拐头向上之势
2. 彩色波带趋势是否趋势向上或者正在拐头向上
3. 六指金叉共振是否出现或即将出现
4. 四色柱处在上涨颜色段或者正在变向中
5. 六彩神龙显示套牢盘在逐渐减少,蓝色主力趋势线显示向上
如果所有这些指示信号明确同步,则大胆买入,但要控制在一个合适的仓位。如果不完全同步,可少量买入。
The appearance of "Enter" or "Add" is a buy signal, verification:
1. Whether the three moving averages in the main chart are trending up or turning upwards.
2. Whether the trend of the colored wave band is trending upward or turning upward.
3. Whether the six-finger golden cross resonance has appeared or will appear soon.
4. The four-color column is in the rising color segment or is changing direction.
5. The six-color dragon shows that the locked-in market is gradually decreasing, and the blue main trend line shows that it is going up.
If all these indicators are clearly synchronized, buy boldly, but control it in a suitable position. If it is not completely synchronized, you can buy a small amount.
出现"减“或者“出”字均为卖出信号, 验证:
1. 主图三均线是否趋势向下或者有拐头向下之势
2. 彩色波带趋势是否趋势向下或者正在拐头向下
3. 六指金叉共振已脱离共振区城
4. 四色柱处在下跌颜色段或者正在变向中
5. 六彩神龙显示套牢盘在逐渐增加或者蓝色主力趋势线显示向下
如果所有这些指示信号明确同步,则果断清仓卖出。如果出现"减“而三均线和彩色波带趋势仍为上涨可渐不卖出, 但要关注它们的变化。如果它们已转向平缓或有微跌趋势则部分减仓,控制风险。如果出现"出“一定要小心,时刻准备清仓卖出,控制风险。
The appearance of "minus" or "out" is a sell signal, verification:
1. Whether the three moving averages in the main chart are trending downward or turning downward
2. Whether the trend of the colored wave band is downward or turning downward
3. The six-indices golden cross resonance has left the resonance area
4. The four-color column is in the falling color segment or is changing direction
5. Six-color Dragon shows that the locked-in market is gradually increasing or the blue main trend line shows downward
If all these indicators are clearly synchronized, then decisively liquidate and sell. If there is a "minus" signal and the trend of the three moving averages and colored bands is still rising, you may not sell them, but pay attention to their changes. If they have turned flat or have a slight downward trend, the position should be lightened to control the risk. If there is a "out"signal you must be careful, and always be ready to sell of all the position to control the risk.
应用范例 Application Examples
例1: 2023/03/10日ProShares Ultra VIX短期期货ETF UVXY的三分钟盘面交易图
Example 1: The three-minute trading chart of ProShares Ultra VIX short-term futures ETF UVXY on March 10, 2023
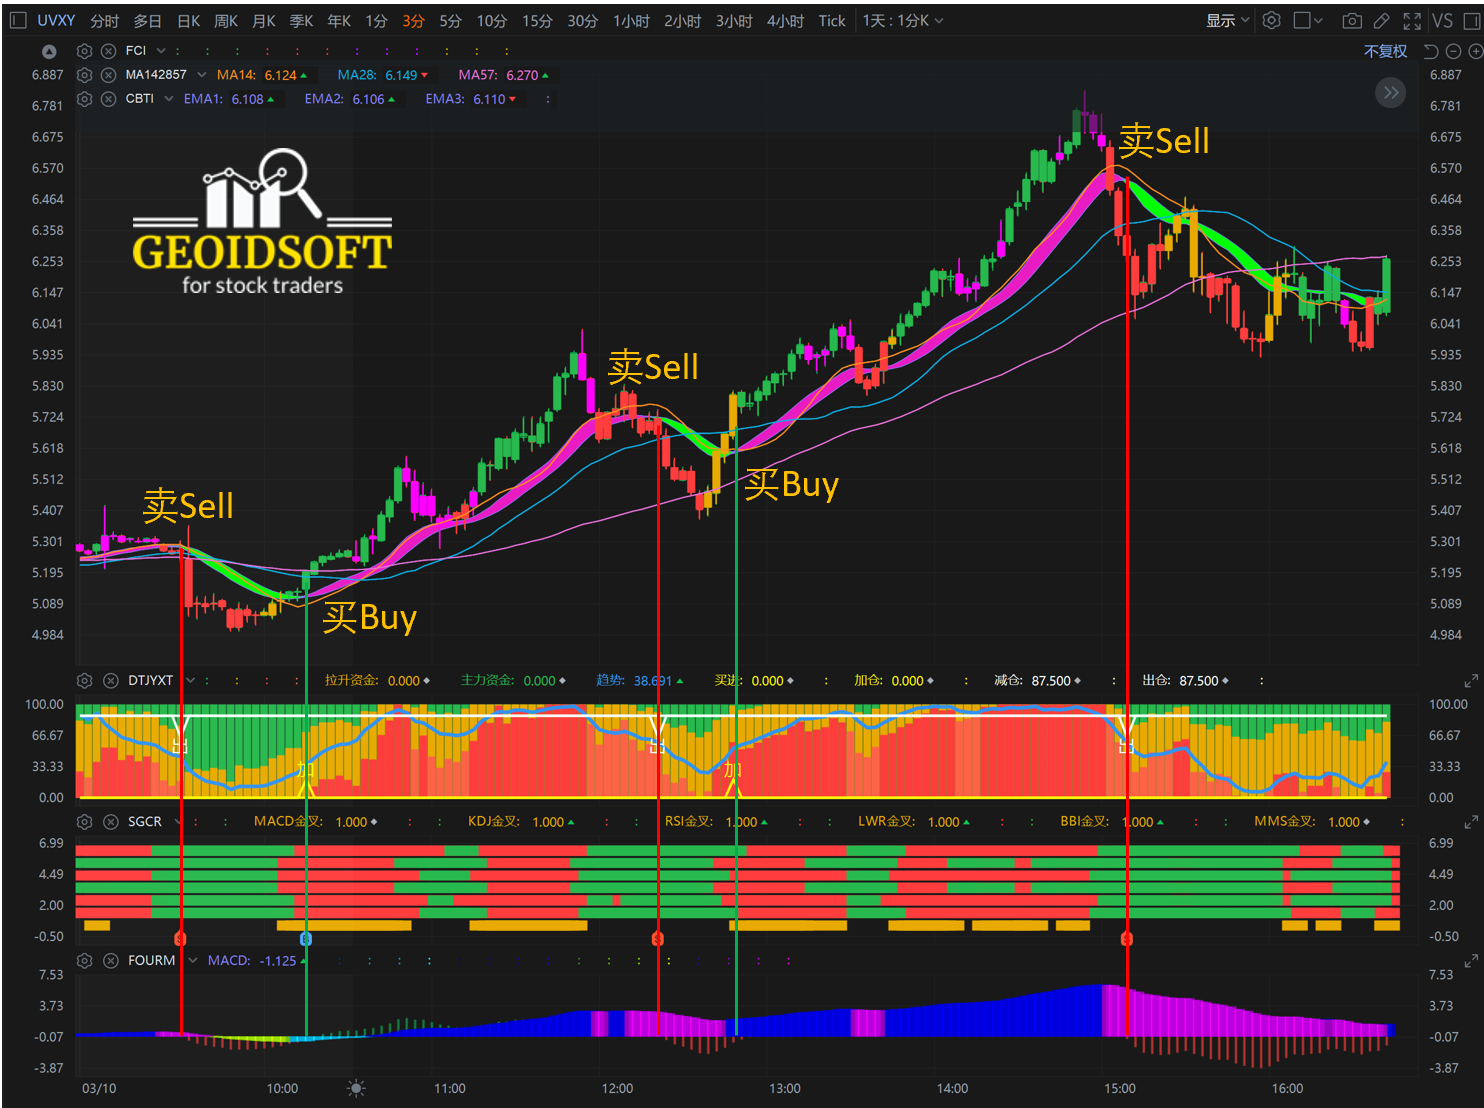
如上图显示的2023/03/10日从上午10到下午16点,ProShares Ultra VIX短期期货ETF UVXY的三分钟盘面交易图, 操盘系统副图指标DTJYXT提示的二次加仓和三次出仓机会均符合实际,按其操作,盈利是非常不错的,并且可以避免二次上涨趋势波段中出现的价格调整,可能引起不安而过早卖出,错失更大盈利的机会。同时,这些提示的机会得到了另外二个副图指标, 即六指金叉共振指标SGCR和四色柱指标FOURM的确认,在操作上增强了交易者敢于动作的信心。
As shown in the figure above, from 10:00 am to 16:00 pm on March 10, 2023, the three-minute trading chart of ProShares Ultra VIX short-term futures ETF UVXY, the sub-chart indicator DTJYXT of the trading system prompts two buying and three selling opportunities. They are all in line with the reality. Following these operations, the profit is very good, and it can avoid the price adjustments in the two upward trend bands, which may cause anxiety and sell prematurely, and then miss the opportunity of greater profit. At the same time, these prompt opportunities were confirmed by the other two sub-chart indicators, namely the six-indices golden cross resonance indicator SGCR and the four-color column indicator FOURM, which enhanced traders' confidence in daring to act.
例2: 2023/03/14日ProShares 纳斯达克指数三倍做多ETF TQQQ的三分钟盘面交易图
Example 2: The three-minute trading chart of the ProShares Nasdaq Index Triple Long ETF TQQQ on March 14, 2023
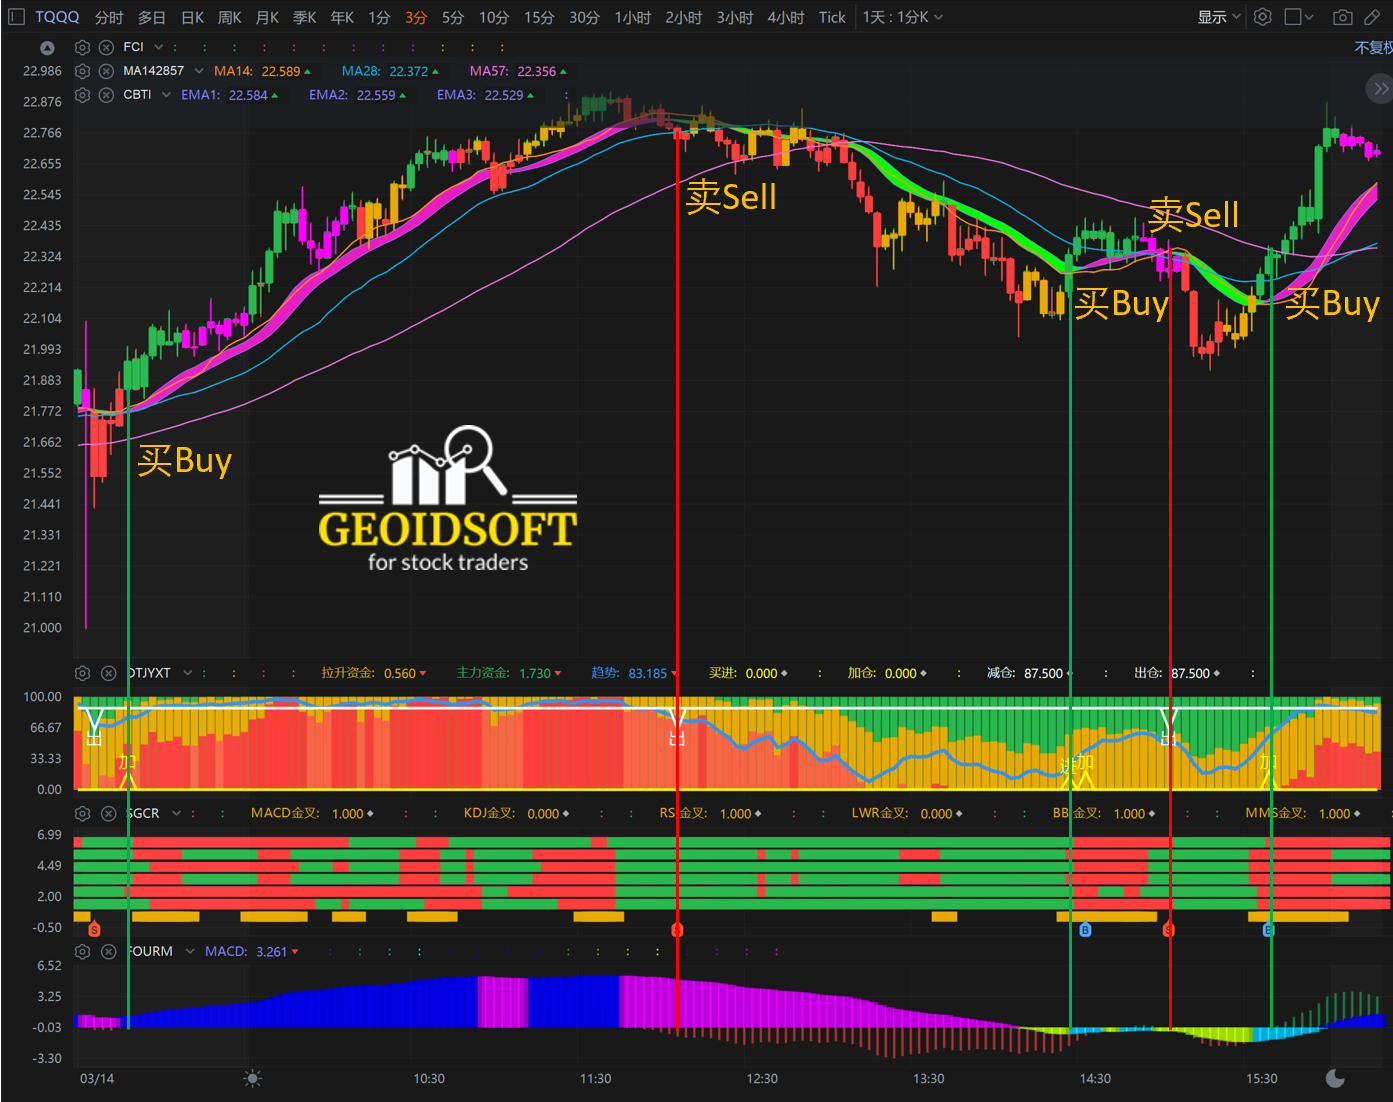
如上图显示的2023/03/14日从上午8点半到下午16点,ProShares 纳斯达克指数三倍做多ETF TQQQ的三分钟盘面交易图, 操盘系统副图指标DTJYXT提示的四次进加仓和三次出仓机会均符合实际,按其操作,效果与例一完全相同。
As shown in the figure above, from 8:30 am to 16:00 pm on March 14, 2023, the three-minute trading chart of the ProShares Nasdaq Index Triple Long ETF TQQQ, the trading system sub-chart indicator DTJYXT prompted four buying opportunities and three selling opportunities. They are all in line with reality, and the effect is exactly the same as Example 1.
更多的应用范例请观看我们的Youtube频道。More application examples please watch our Youtube channel.
https://youtu.be/YbVcP232c0M
适用范围 Scope of Application
波段趋势超短线交易系统适合各种周期的盘面,对于长期趋势的“年线”、“季线”和“月线”图,以及中期趋势的“周线”和“日线”图,可以用它来做目前股市状态分析。对于短期趋势的“小时”及“分钟”图,可以用它来做日内交易操盘。建议以三分钟盘面作为基本盘,其它时间周期的盘面作为趋势复核,提高每笔交易的正确判断。注意:一分钟盘面显示的价格变化过于频繁,不宜作交易盯盘。一旦出现了交易信号,用它来帮助确定一个比较好的交易点是有帮助的。
The Six-color Dragon Indicator is suitable for various time cycles of the market, from the long-term trend "annual line", "seasonal line" and "monthly line" charts, as well as the medium-term trend "weekly line" and "daily line" charts, and even the "hour" and "minute" charts of the short-term trend can visually observe the changes of the bargaining chips, main funds and retail floating funds at that time.
The wave band trend ultra-short-term trading system is suitable for various time cycles of the market. For the "annual line", "seasonal line" and "monthly line" charts of long-term trends, as well as the "weekly line" and "daily line" charts of medium-term trends, you can use it to analyze the current state of the stock market. For the "hour" and "minute" charts of short-term trends, it can be used for intraday trading. It is recommended to use the three-minute chart for intraday trading, and the other time periods as a trend review to improve the correct judgment of each transaction. Note: The price changes displayed on the one-minute chart are too frequent, so it is not suitable for trading. Once a trade signal appears, it is helpful to use it to identify a good trade point.
注意事项 Precautions
没有一个交易系统能够确保您的每笔交易正确无风险,即使正确买进,不注意盈利的保护,也会导致严重的损失。借助于这一波段趋势超短线交易系统,能否取得成功,仍然取决于您的交易经验,能够理解股市盘面价格变化并迅速作出判断采取行动的能力。波段趋势超短线交易系统仅仅能够给您图示化的信息帮助, 帮您作出快揵和更加准确的判断。
There is no trading system that can ensure that each of your transactions is correct and risk-free. Even if you buy correctly, if you don't pay attention to the protection of profits, it will lead to serious losses. With the help of this wave band trend ultra-short-term trading system, whether you can succeed still depends on your trading experience, your ability to understand the price changes on the stock market and quickly make judgments and take actions. The wave band trend ultra-short-term trading system can only give you graphical information to help you make quick and more accurate judgments.
建议投资者在运用这一系统进行实际的操盘之前,首先运用富途软件的模拟交易功能进行足够的练习,待到有盈利能力时再进行实际交易。另外,采用这一系统一定要选择交易量足够大的股票,比如标普500指数和纳斯达克指数相关的ETF产品和大型科技龙头公司的股票,以保证系统的效果和稳定性。
It is recommended that investors use the simulated trading function of Futu software for sufficient practice before using this system for actual trading, and then conduct actual trading when there is profitability. In addition, when using this system, it is necessary to choose stocks with sufficient trading volume, such as ETF products related to the S&P 500 Index and Nasdaq Index, and stocks of leading technology companies to ensure the effectiveness and stability of the system.
观看介绍如何在富途软件上测试或者练习一个操盘系统的YouTube视频 Watch YouTube video that introduces how to test or practice a trading system on Futu software.
自己的投资, 自已决定和自已负责!
Invest yourself, decide and be responsible for yourself!

