指标特色 Indicator Features
四色柱副图指标将MACD指标展示的四个股价变化阶段用不同的颜色表示出来,让投资者快速了解当前的价格变化阶段。
The four-color column sub-chart indicator displays the four stock price change stages displayed by the MACD indicator in different colors, allowing investors to quickly understand the current price change stage.
指标原理 Indicator Principle
四色柱,由MACD优化而来。MACD本身,就是一个经典中的经典指标,所以,四色柱也算是个经典指标了。
Four-color column, optimized by MACD. MACD itself is a classic indicator in the classics, so the four-color column is also a classic indicator.
指标说明 Indicator Description
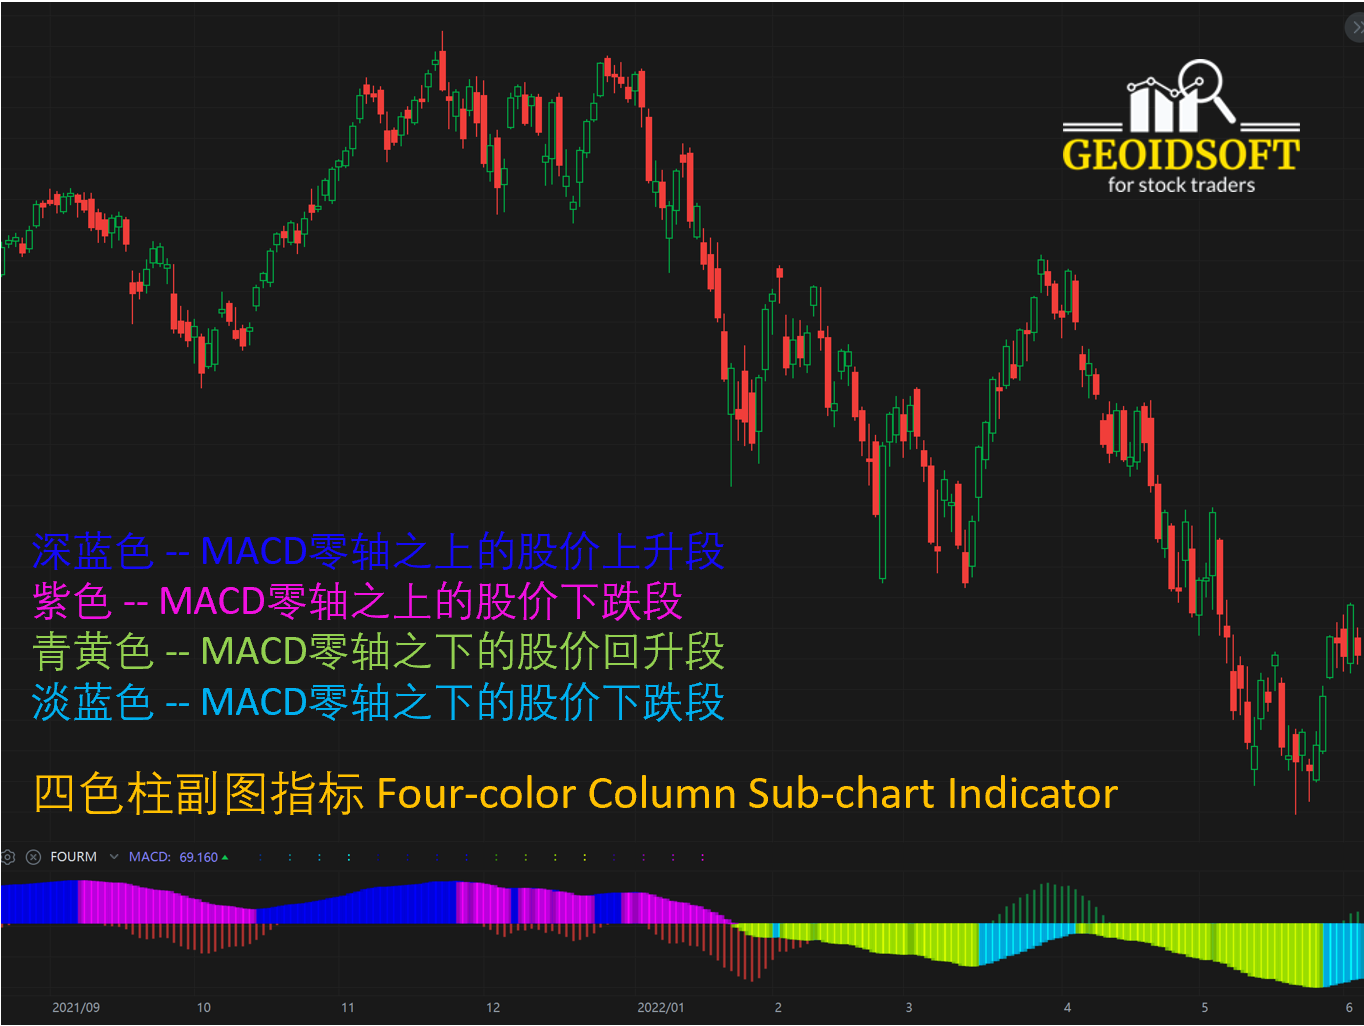
【四色柱】如上图指标,四色柱所用的四种颜色所表示的四个股价变化阶段:
1. 深蓝色 -- MACD零轴之上的股价上升段
2. 紫色 -- MACD零轴之上的股价下跌段
3. 青黄色 -- MACD零轴之下的股价回升段
4. 淡蓝色 -- MACD零轴之下的股价下跌段
[Four-color column] As shown in the above figure, the four colors used in the four-color column represent the four stock price change stages:
1. Light blue -- the stock price decline below the MACD zero axis
2. Dark blue -- the rising segment of the stock price above the zero axis of MACD
3. Purple -- the stock price decline above the MACD zero axis
4. Green-yellow -- the stock price recovery segment below the zero axis of MACD
应用法则 Application Rules
淡蓝色出现买入,深蓝色出现满仓, 紫色出现卖出,青黄色出现空仓。操作策略:随色彩变化而改变。
Light blue indicates buy, dark blue indicates full position, purple indicates sell, and green yellow indicates short position. Operating strategy: change with the color change.
适用范围 Scope of Application
四色柱指标适合各种周期的盘面,从长期趋势的“年线”、“季线”和“月线”图,以及中期趋势的“周线”和“日线”图,甚至短期趋势的“小时”及“分钟”图,均可直观地观察当时的价格变化阶段。
The four-color K-line indicator is suitable for various time cycles of the market, from the long-term trend "annual line", "seasonal line" and "monthly line" charts, as well as the medium-term trend "weekly line" and "daily line" charts, and even the "hour" and "minute" charts of the short-term trend. It shows visually the price change stage at that time.
建议作为背景了解价格变化, 结合其他指标进行综合分析观察,构建更有效的操盘系统, 帮助您进行操盘决策。
It is recommended to use this indicator for understanding the price changes in the market as a background, and conduct comprehensive analysis and observation in combination with other indicators to build a more effective trading system that will help you make trading decisions.
注意事项 Precautions
指标的计算结果与一些预设的参数有关。可以根据自己习惯的操盘周期进行优化和调整, 以便达到最佳效果。
The calculation result of the indicator is related to some preset parameters. It can be optimized and adjusted according to the trading cycle you are used to in order to achieve the best results.

