指标特色 Indicator Features
交易量柱是买卖双方在某一时段某一价位上的矛盾斗争的暂时平衡柱,是一个特殊的“量价平衡柱”。交易量柱特色指标是每时每刻实际成交状况的原始记录,它是未经人工修饰的、实实在在的量价指标。它是庄家和主力动向与意图的真实地展示,看懂了量柱,就看懂了庄家。
The trading volume column is a temporary balance column for the conflict between buyers and sellers at a certain price at a certain period of time. It is a special "volume price balance column". The characteristic indicator of the trading volume column is the original record of the actual transaction status at each moment. It is a real volume and price indicator without artificial modification. It is a true display of the trend and intention of the dealer and the main force. If you can understand the measuring column, that means you can understand the dealer. Originality is its nature and characteristic.
指标说明 Indicator Description
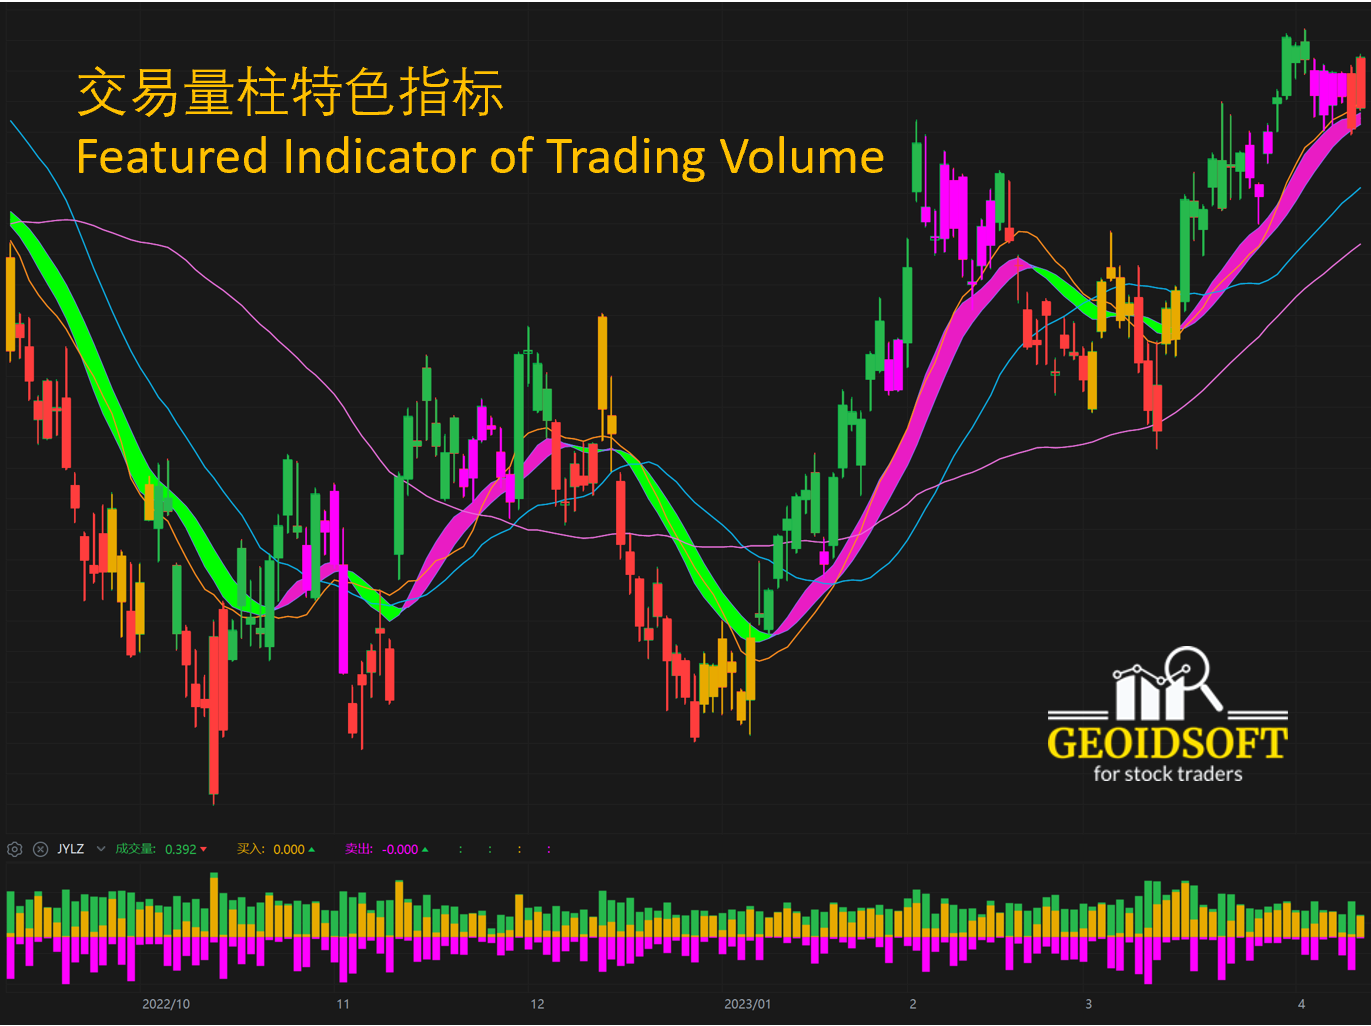
【交易量柱特色指标】如上图副图指标,柱线颜色分别代表:绿色-总的成交量; 成交量大,量柱就高;成交量低,量柱就低; 黄色-导致股价上涨的买入量; 紫色-导致股价下跌的卖出量。
【Featured indicator of trading volume】As shown in the sub-chart above, the color of the column line represents: green - the total trading volume; the larger the trading volume, the higher is the volume column; the lower the trading volume, the lower is the volume column; yellow - the Buy volume that caused the stock price to rise; Purple - Sell volume that caused the share price to drop.
指标应用 Application
量柱的原生性、真实性、全息性,蕴藏着丰富的有待开发的潜能,为开发不同的量柱战法提供了可靠的依据,这是任何一种技术指标不可替代的。从大量的研究中发现,量柱可以将无序的走势有序化,也可以将零散的价柱系统化,还可以将主力的操盘思路节律化。
基于不同的量柱分析方法,人们开发了各种各样的量柱战法, 比如,1. 量柱必胜战法, 2. 黄金低量柱战法, 3. 梯量柱战法, 4. 倍量柱战法, 5. 高量柱战法等等。归纳起来,量柱战法的根本在于学会认识各种量柱的型态,掌握型态后面的奥秘, 预见发展动向,并用于实际的交易。
量柱的基本型态包括:
倍量柱 – 凡是倍量柱的当天几乎都是阶段性底部, 走势的转折点, 后面都有一波的上升走势。
高量柱 – 如果后面三根量柱逐步缩小, 而三根K线却逐步升高, 形成价涨量缩的量价背离态势, 是介入的好机会。
缩量柱 – 连续量缩价跌, 产生本阶段的最低量柱后必然向上。缩量一倍是市场转折标志, 缩倍柱+倍量柱是难得介入的机会。
梯量柱 – 反映卖盘逐步增加, 价格逐步抬高, 主力逐步增仓。多数梯量柱的未来走势是向下, 少数是向上。
平量柱 – 并肩平量柱是温和上升, 凹口平量柱是大幅上升。
低量柱 – 后面的走势一定是上升, 是起死回生的转折点。如果低量柱次日出现倍量柱就是介入最好的时机。
黄金柱 – 倍量柱/高量柱/梯量柱/平量柱 + 三日缩量柱。条件是黄金柱后三天必须是价涨量缩的缩量柱。黄金柱后通常有一波上涨行情。
量柱必胜战法: 阳胜进,阴胜出; 小倍阳,大胆入。
阳胜进:今天的量柱、价柱都高于昨天,就是“阳胜”,阳胜进这里指的是“双阳胜就买进”;
阴胜出:今天的量柱、价柱都低于昨天,就是“阴胜”,阴胜出指的是“双阴胜就卖出”;
单倍阳:今天的量柱比昨天的量柱高一倍左右,并且阳线实体高于前日;
大胆入:标准是“双阳胜”,如果是“单阳胜” 就需要观察一阵子。
几种量柱的综合研判
1) 缩量柱/低量柱+倍量柱:后势或大涨。一般来说低量柱+倍量柱的组合是主庄采用“休克疗法”探底之后心中有数的主动拉升行为,其后势大涨的概率很高。
2)倍量柱+倍量柱:后势或大涨,但当心物极必反。这种组合一般在阶段底部,往往是主庄控盘很好急于拉升的一种表现。但是,值得注意的是,如果连续三根倍量很有可能会物极必反, 庄家在出货。
3)高量柱+缩量柱:可能出现“价涨量缩”。紧靠着高量柱或倍量柱后的缩量柱被认为是最具价值的缩量柱。
4)缩量柱缩量1倍:市场出现拐点。缩量1倍的缩量柱是市场拐点出现的重要标志,机会或许就在眼前。
5)价升量涨高点逢阴即出,量缩价升持股待涨。
应用范例请观看我们的Youtube频道。For application examples, please watch our Youtube channel.
https://youtu.be/QQ7Lpe2rTRs
建议作为背景了解当前买卖力量的发展变化, 沿着历史的轨迹,预视发展动向,并做出价值取向, 同时结合其他指标进行综合分析观察,构建更有效的操盘系统, 帮助您进行操盘决策。
The originality, authenticity, and holographic nature of the measuring column contain rich potentials to be developed, which provide a reliable basis for the development of different measuring column tactics, which is irreplaceable by any technical index. It has been found from a large number of studies that the volume column can order the disordered trend, systematize the scattered price columns, and rhythmize the trading ideas of the main force.
Based on different quantitative column analysis methods, people have developed a variety of quantitative column tactics, for example, 1. Quantitative column must-win tactics, 2. Gold low volume column tactics, 3. Ladder quantitative column tactics, 4 . Multiple column tactics, 5. High volume column tactics, etc. In summary, the fundamental of measuring column tactics or the application of the indicator is to learn and understand the patterns of various quantity columns, master the mystery behind the patterns, foresee development trends, and use them in actual trading.
It is recommended to use it as a background information to understand the current development and changes of buying and selling forces, follow the historical track, foresee the development trend, determine a value orientation, and conduct comprehensive analysis and observation in combination with other indicators to build a more effective trading system to help you make trading decisions.
适用范围 Scope of Application
交易量柱特色指标适合各种周期的盘面,从长期趋势的“年线”、“季线”和“月线”图,以及中期趋势的“周线”和“日线”图,甚至短期趋势的“小时”及“分钟”图。实际应用时,一般采用日K线图。
The Featured Indicator of Trading Volume is suitable for various time cycles of the market, from the long-term trend "annual line", "seasonal line" and "monthly line" charts, as well as the medium-term trend "weekly line" and "daily line" charts, and even the "hour" and "minute" charts of the short-term. In actual application, the daily K-line chart is generally used.

