指标特色 Indicator Features
OBV能量潮又称为平衡交易量,是由美国投资分析家Joe Granville 1960年代提出的,它的理论基础是“能量是因,股价是果”。OBV将成交量数字化,制成趋势线,配合股价的走趋,从价格变动及成交量的增减关系,推测市场价格的走势,是一个很好的量价分析指标。
The OBV energy tide, also known as balanced trading volume, was proposed by American investment analyst Joe Granville in the 1960s. Its theoretical basis is "energy is the cause, and stock prices are the effect." OBV digitizes the trading volume and makes it into a trend line. In line with the trend of stock prices, it is a good volume price analysis indicator to speculate on the trend of stock prices from the relationship between price changes and the increase and decrease of trading volume.
指标说明 Indicator Description

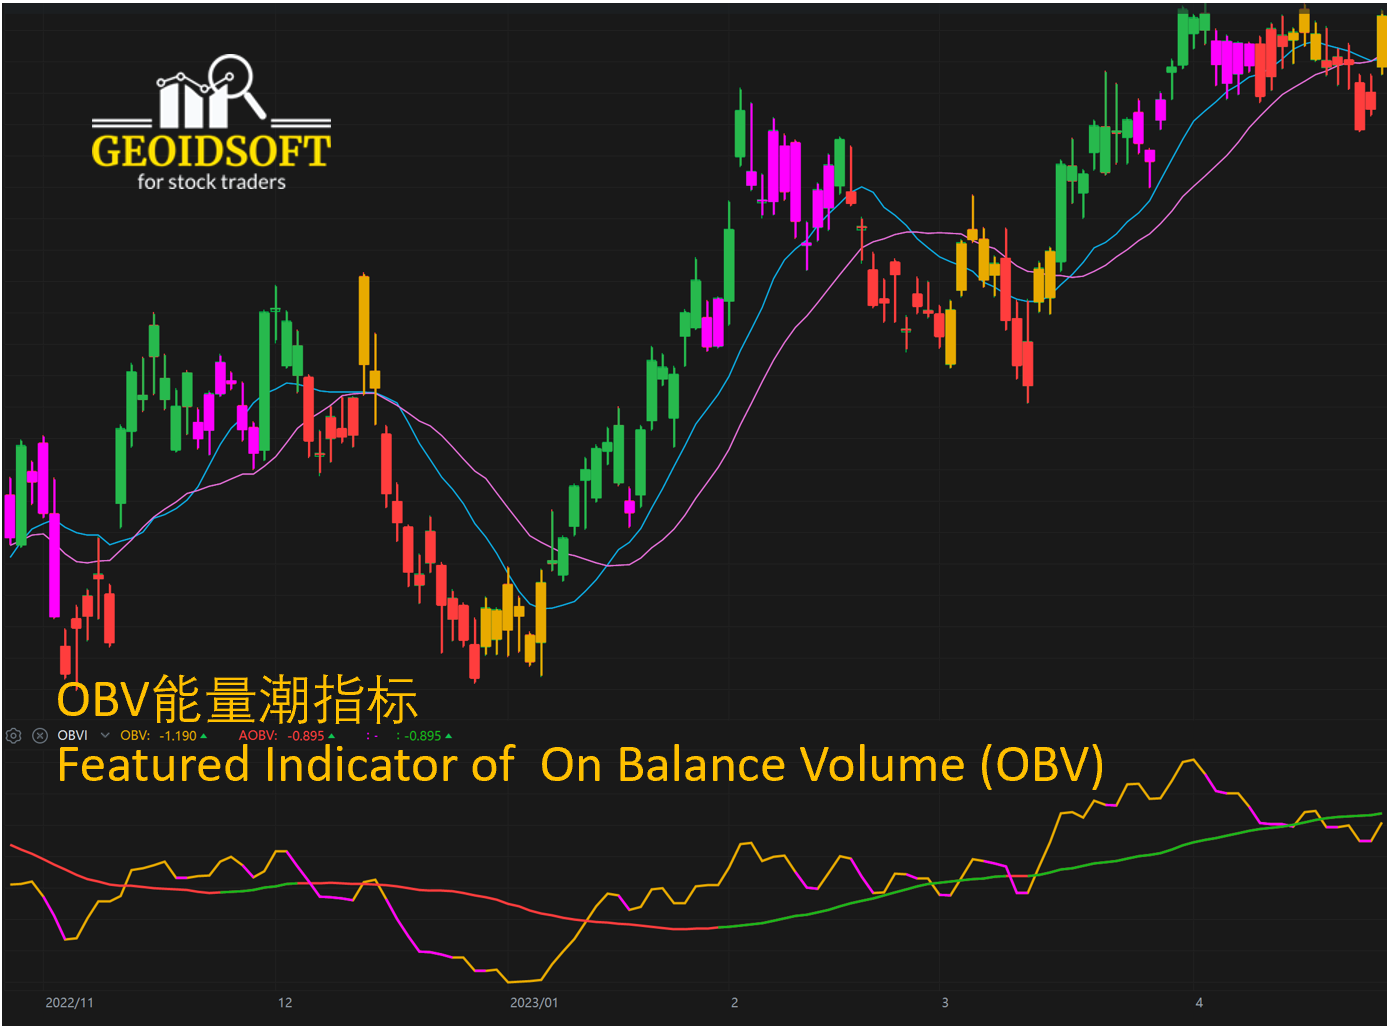
【OBV能量潮指标】如上图副图所示,OBV能量潮指标由一条OBV线和它的三十四天均线组成。为了区分上涨和下跌趋势,OBV曲线用黄色和紫色进行标示,而OBV均线则用绿色和红色进行标示。
【Featured Indicator of On Balance Volume】As shown in the sub-figure above, the Featured Indicator of On Balance Volume consists of an OBV line and its 34-day moving average. To distinguish uptrends from downtrends, OBV curves are marked in yellow and purple, while OBV moving averages are marked in green and red.
指标应用 Application
因为成交量体现了庄家的买卖动作,所以通过OBV指标可以很好地发现庄家何时吸筹,何时拉升,甚至可以预判出股价即将脱离盘整区,做到先知先觉。
Because the trading volume reflects the dealer's buying and selling actions, the OBV indicator can be used to trace down these actions, and even predict the price trend of the stock price in foresight.
应用范例请观看我们的Youtube频道。For application examples, please watch our Youtube channel.
https://youtu.be/Durr5Zl2g34

适用范围 Scope of Application
OBV能量潮指标适合各种周期的盘面,从长期趋势的“年线”、“季线”和“月线”图,以及中期趋势的“周线”和“日线”图,甚至短期趋势的“小时”及“分钟”图,均可直观地观察当时成交量的变化。
The OBV indicator is suitable for various cycles of market, from the "annual line", "seasonal line" and "monthly line" charts of long-term trends, to the "weekly" and "daily line" charts of medium-term trends, and even the short-term trend charts "Hour" and "minute" charts can visually observe the changes in trading volume at that time.


